USD/CAD keeps heading south and approaches important support at 1.3520

- The USD dives for the third consecutive day.
- Hopes of Fed easing are weighing on the Greenback.
- The Lonie appreciates with oil prices rising steadily.
The US Dollar has extended losses against its Canadian counterpart on Tuesday reaching to hit session lows at 1.3526, only a few pips above three-week lows at 1.3520.
Hopes of Fed easing are weighing on the US Dollar
The greenback has remained on the back foot on the back of the release of Friday’s macroeconomic figures. The PCE core prices Index showed cooling inflation for the third consecutive month, while US consumer spending remained practically unchanged in November.
These figures add reasons to anticipate a slowdown in Federal Reserve's rate hikes, which is acting as a headwind for the US dollar.
Furthermore, oil prices have continued crawling higher, with the US benchmark WTI reaching levels past $80, which has appreciated nearly 15% from early December lows. The rising crude prices offer additional support to the commodity-linked CAD, which has gained about 1.25% over the last seven days.
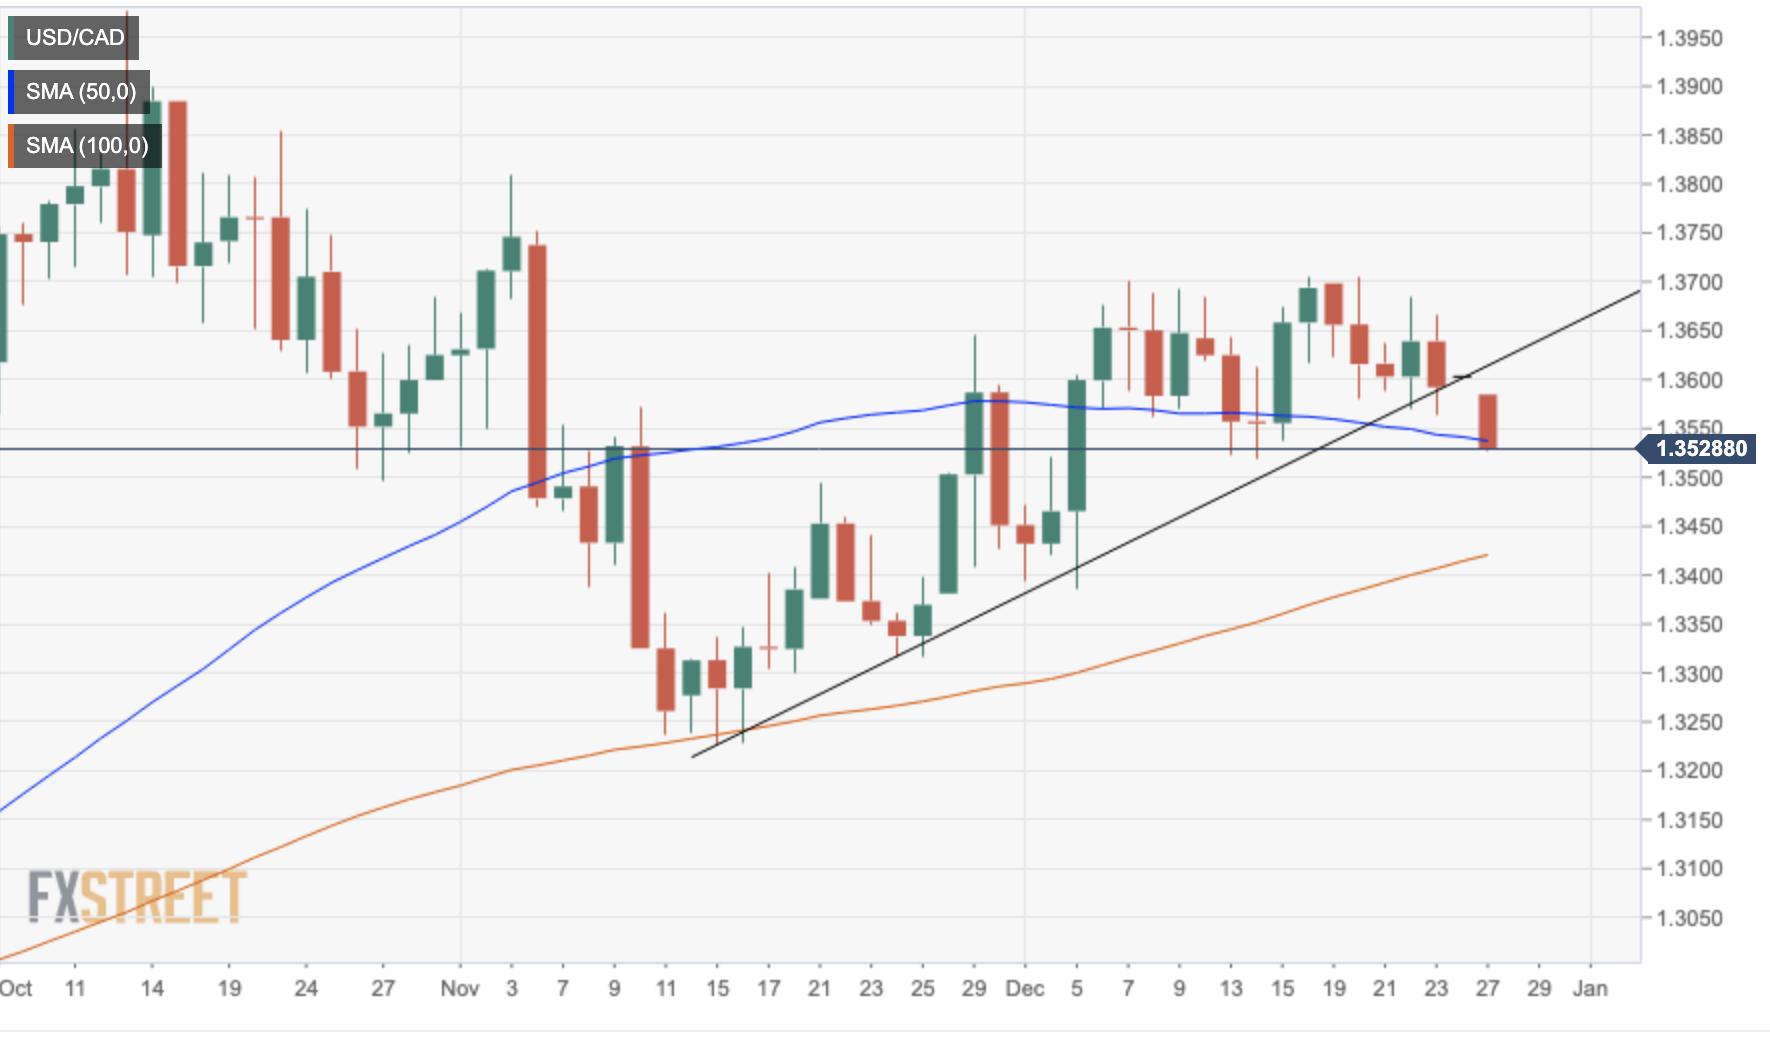
USD/CAD about to test 1.3520 support
From a technical point of view, the breach of trendline support in the vicinity of 1.3600 has negated the USD/CAD’s upside trend from Mid-November lows at 1.3230, and the pair seems set to test 1.3520 support area, which could trigger further selling pressure.
A confirmation below the mentioned 1.3520 might boost confidence for bears to push the pair towards the 100-day SMA, now at 1.3410 on its way to December 5 low at 1.3385.
On the upside, the pair should return above the 50’day SMA, at 1.3540 to ease negative pressure and attempt to regain the previous trendline support at 1.3630 before aiming for December’s peak, at 1.3700.
USD/CAD Daily Chart
Technical levels to watch
Reprinted from FXStreet_id,the copyright all reserved by the original author.
Disclaimer: The content above represents only the views of the author or guest. It does not represent any views or positions of FOLLOWME and does not mean that FOLLOWME agrees with its statement or description, nor does it constitute any investment advice. For all actions taken by visitors based on information provided by the FOLLOWME community, the community does not assume any form of liability unless otherwise expressly promised in writing.
FOLLOWME Trading Community Website: https://www.followme.com


Hot
No comment on record. Start new comment.