EUR/USD Price Analysis: Floats above 1.0580 support

- EUR/USD remains sidelined around three-week-old horizontal support, fades upside momentum of late.
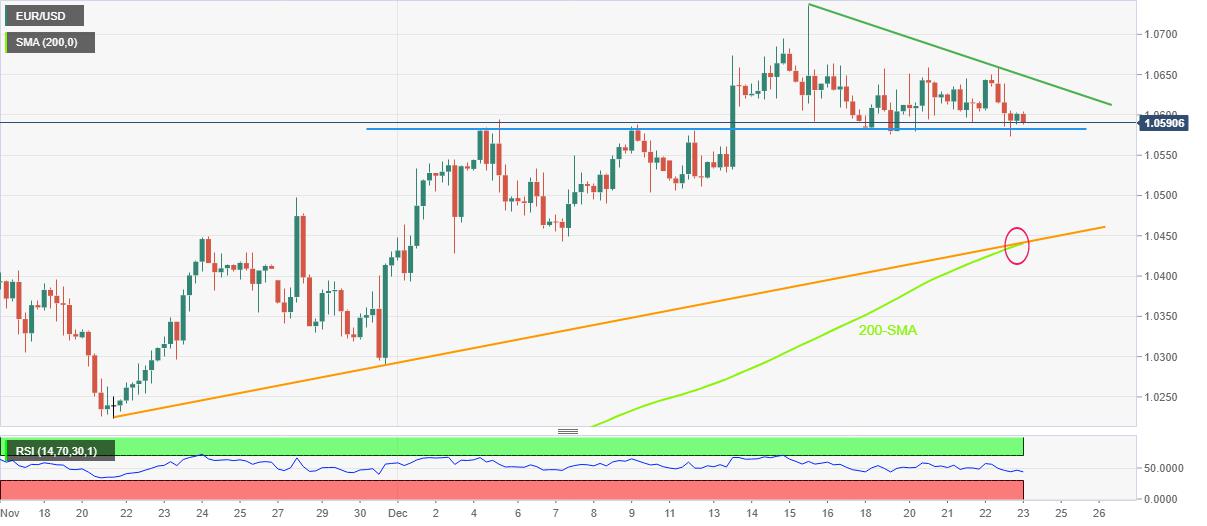
- Downbeat RSI keeps bears hopeful of meeting 1.0440 support confluence.
- Bulls need to cross the weekly resistance line to retake control.
EUR/USD fades late Thursday’s corrective bounce off short-term key support as it retreats to 1.0590 during Friday’s Asian session.
Not only the failure to stay beyond the short-term key support but the RSI (14) line also keeps the pair sellers hopeful by printing the sub-50 level but staying beyond the oversold region.
As a result, the quote is likely to break the aforementioned three-week-old horizontal support line, close to 1.0580.
Following that, a slump toward the previous weekly low near the 1.0500 round figure becomes imminent.
However, a convergence of the 200-SMA and a one-month-long ascending trend line, close to 1.0440, appears a tough nut to crack for the EUR/USD bears afterward.
In a case where the pair sellers manage to keep the reins past 1.0440, the late November swing low near 1.0220 will gain the market’s attention.
On the flip side, a one-week-old descending resistance line, close to 1.0650, guards the EUR/USD pair’s immediate recovery moves.
Also acting as upside filters are multiple hurdles around 1.0660 and 1.0700, a break of which could challenge the monthly high of 1.0736.
To sum up, EUR/USD holds onto the bearish bias despite the latest inaction around the short-term key support.
EUR/USD: Four-hour chart
Trend: Further downside expected
Reprinted from FXStreet_id,the copyright all reserved by the original author.
Disclaimer: The content above represents only the views of the author or guest. It does not represent any views or positions of FOLLOWME and does not mean that FOLLOWME agrees with its statement or description, nor does it constitute any investment advice. For all actions taken by visitors based on information provided by the FOLLOWME community, the community does not assume any form of liability unless otherwise expressly promised in writing.
FOLLOWME Trading Community Website: https://www.followme.com


Hot
No comment on record. Start new comment.