WTI Price Analysis: Oil bulls can ignore recent inaction surrounding $76.00

- WTI crude oil struggles to defend the bounce off 50-HMA, remains sidelined of late.
- Firmer RSI line backs gradual recovery on prices, suggesting further advances of the quote.
- Sellers need clear break of 200-HMA to retake control.
WTI crude oil grinds higher around $76.00 during early Tuesday, struggling to keep the bounce off the 50-HMA of late.
Even so, the recently higher lows on the oil prices gain support from the firmer RSI (14) line, which in turn suggests the quote to remain firmer.
That said, a downward-sloping resistance line from the last Thursday, around $76.50 by the press time, restricts the black gold’s immediate upside.
Should the quote remains firmer past $76.50, the $77.00 round figure and the latest swing high surrounding $77.80 could challenge the commodity buyers before directing them to the monthly peak of $83.30.
It’s worth noting that the $80.00 psychological magnet might act as an extra filter to the north.
On the flip side, the 50-HMA and ascending trend line from Friday restrict short-term WTI downside near $75.25 and $74.65 respectively.
Following that, a convergence of the 200-HMA and a one-week-old ascending trend line, close to $74.30, could challenge the quote’s further downside.
In a case where WTI remains bearish past $74.30, the odds of witnessing a slump toward the monthly low near $70.45 can’t be ruled out.
Overall, oil prices are likely to remain firmer despite the latest struggle to defend bulls.
WTI: Hourly chart
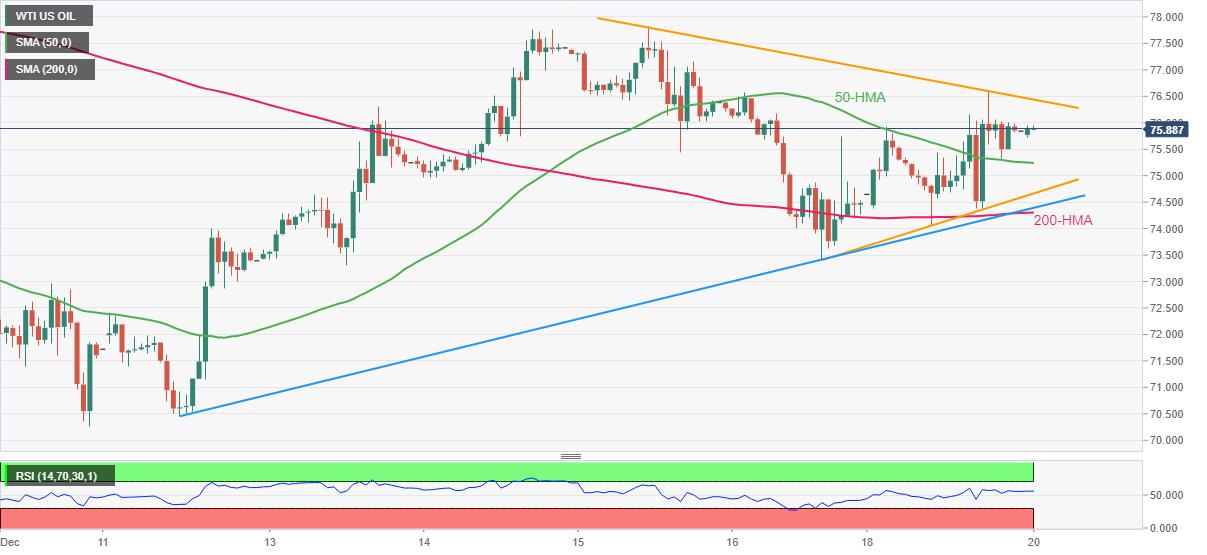
Trend: Further upside expected
Reprinted from FXStreet_id,the copyright all reserved by the original author.
Disclaimer: The content above represents only the views of the author or guest. It does not represent any views or positions of FOLLOWME and does not mean that FOLLOWME agrees with its statement or description, nor does it constitute any investment advice. For all actions taken by visitors based on information provided by the FOLLOWME community, the community does not assume any form of liability unless otherwise expressly promised in writing.
FOLLOWME Trading Community Website: https://www.followme.com


Hot
No comment on record. Start new comment.