EUR/JPY Price Analysis: Fluctuates around 144.60s after piercing the 20/50-day EMAs

- The EUR/JPY is recovering from Tuesday’s losses and rose 0.38% on Wednesday.
- EUR/JPY: Break above 145.30s could pave the way for further gains.
The EUR/JPY erases some of Tuesday’s losses and clings to gains above the psychological 144.00 figure, after a volatile trading session in Wall Street, following the US Federal Reserve (Fed) decision to hike rates by 50 bps. As the Asian Pacific session begins, the EUR/JPY is trading at 144.60.
EUR/JPY Price Analysis: Technical outlook
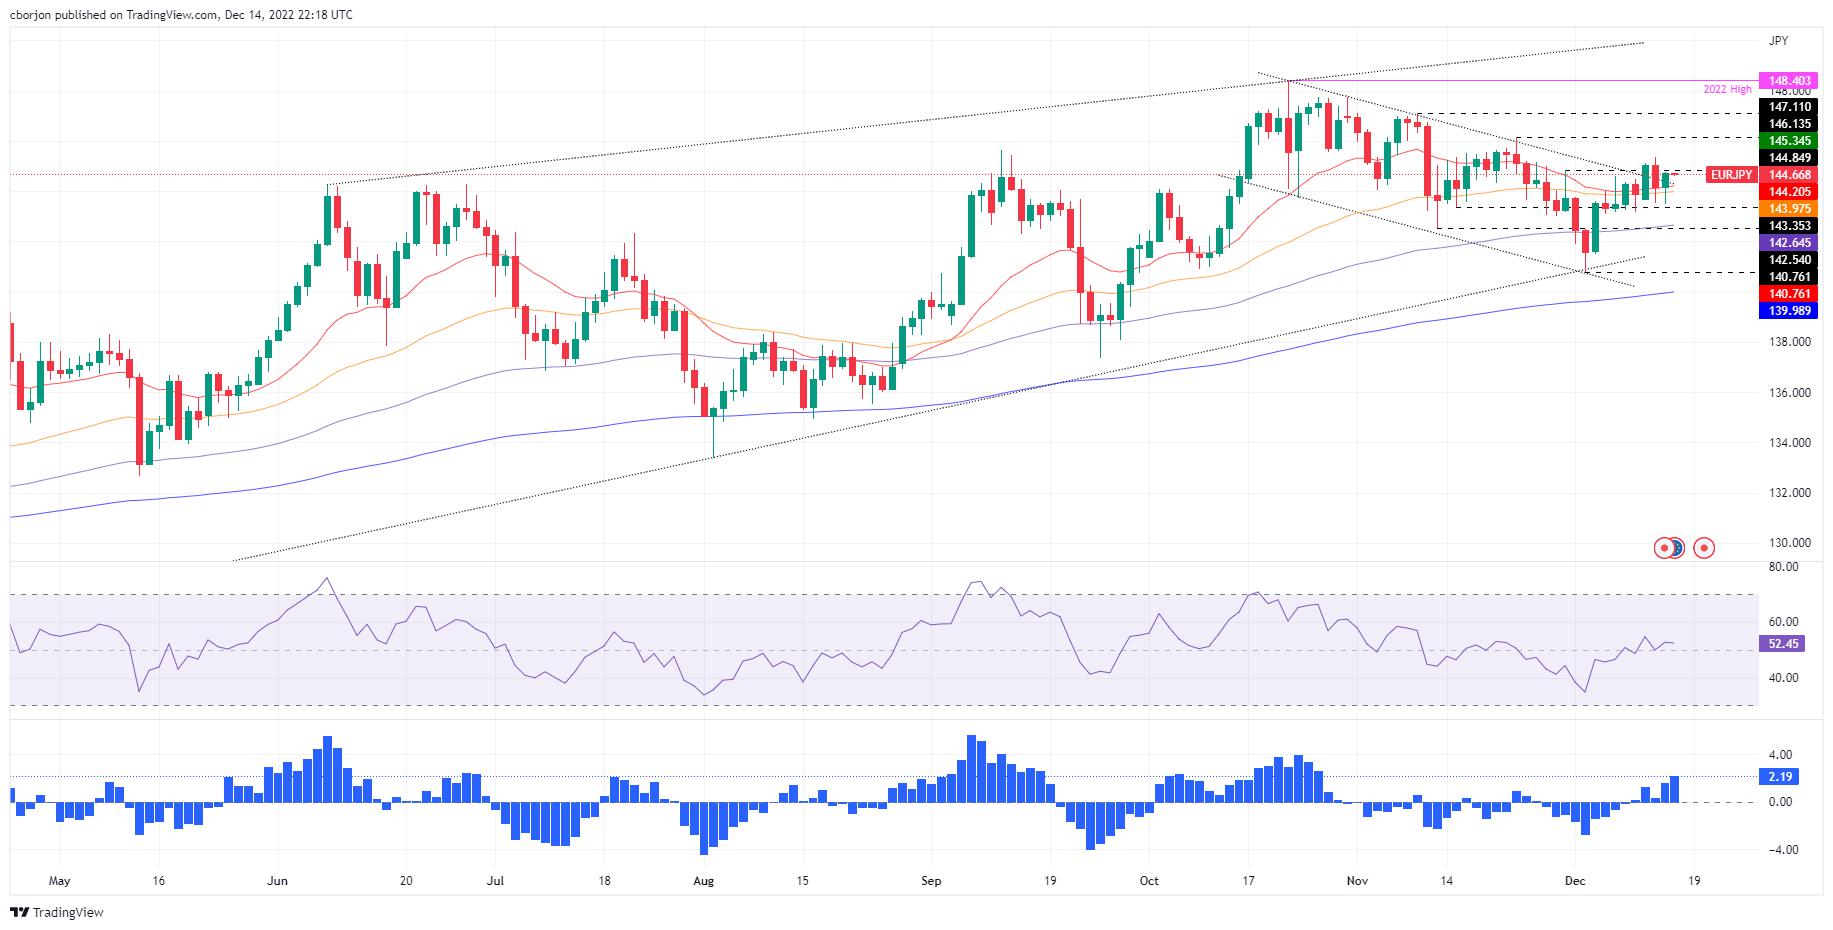
The EUR/JPY daily chart suggests the cross is slightly upward biased, though with some risks skewed to the downside. For the cross to extend its weekly gains, the EUR/JPY needs to clear the weekly high reached on December 14 at around 145.34, which would exacerbate a rally toward the November 23 pivot high at 146.13. Once cleared, the next resistance would be the November 9 daily high of 147.11.
EUR/JPY’s failure to clear the weekly high could pave the way for consolidation and a fall toward the week’s lows. The EUR/JPY key support levels would be the 20-day Exponential Moving Average (EMA) at 144.20, followed by the 50-day EMA at 143.97. A breach of the latter would be crucial, exposing 143.17, the current week’s low, which, once removed, will drag prices toward the 100-day EMA at 142.64.
From a momentum point of view, the Relative Strength Index (RSI) suggests that neither buyers/sellers are in charge, with RSI almost flat, nearby 50. However, the Rate of Change (RoC) suggests that buyers are gathering momentum. Therefore, further EUR/JPY upside is expected.
EUR/JPY Key Technical Levels
Reprinted from FXStreet_id,the copyright all reserved by the original author.
Disclaimer: The content above represents only the views of the author or guest. It does not represent any views or positions of FOLLOWME and does not mean that FOLLOWME agrees with its statement or description, nor does it constitute any investment advice. For all actions taken by visitors based on information provided by the FOLLOWME community, the community does not assume any form of liability unless otherwise expressly promised in writing.
FOLLOWME Trading Community Website: https://www.followme.com


Hot
No comment on record. Start new comment.