Gold Price Forecast: XAU/USD sellers eye $1,780 on firmer US Dollar ahead of US inflation, Fed announcements

- Gold price takes offers to renew intraday low, snaps four-day uptrend.
- Cautious sentiment ahead of the key data/events, recession woes favor XAU/USD bears.
- Bearish RSI divergence on four-hour chart adds strength to the downside bias.
Gold price (XAU/USD) begins the bumper week on the negative side as it renews intraday low near $1,792 while printing the first daily loss in five during early Monday.
In doing so, the yellow metal takes clues from the US Dollar strength ahead of crucial catalysts.
Other than the anxiety ahead of the market-moving catalysts, the chatters surrounding the recession also underpin the US Dollar’s safe-haven demand and weigh on the Gold price.
That said, the US Dollar Index (DXY) remains firmer around 105.15 while extending the first weekly gain in three. In doing so, the DXY cheers firmer US data and hawkish hopes from the US Federal Reserve.
US Producer Price Index (PPI) matched the market forecasts of 7.4% YoY for November versus 8.1% prior. Further, the Core PPI rose to 6.2% YoY versus 6.0% expected and 6.7% previous readings. Additionally, preliminary readings of the University of Michigan’s (UoM) Consumer Sentiment Index rose to 59.1 for December versus 53.3 market forecasts and 56.8 final readings for November. Moreover, the 1-year inflation expectations dropped to 4.6%, the lowest since September 2021 while compared to 4.9% expected whereas 5-10 year expectations were stable at 3.0%. It should be noted that the US ISM Services PMI improved to 56.5 versus 54.4 expected.
On the other hand, US Treasury Secretary Janet Yellen said, “There's a risk of a recession, but it certainly isn't something that is necessary to bring inflation down.” Further, the economic slowdown fears could be linked to the yield curve inversion as the US 10-year Treasury bond yields and the two-year bond coupons portray a negative difference, suggesting the market’s preference for the short-term US Treasury bonds that print the recession woes.
Amid these plays, the S&P 500 Futures print mild losses while tracking Friday’s downbeat close of Wall Street whereas the US 10-year Treasury yields remain firmer around 3.58%. It should be observed that the US 2-year Treasury bond yields flash 4.35% as the latest quote.
Looking forward, a light calendar may restrict immediate Gold price moves but a bumper week comprising the US Consumer Price Index (CPI) for November, the Fed’s verdict and monthly PMI data for the US will be crucial to watch. Above all, clues about the Fed’s future rate hikes will be important for clear directions.
Gold price technical analysis
Gold price justifies the bearish RSI (14) divergence as it drops towards a one-month-old ascending support line, near $1,780 by the press time.
It should be noted that the Relative Strength Index (RSI) line, placed at 14, diverges from the XAU/USD price as the quote printed higher highs but the oscillator marked lower tops, which in turn suggests that the upside momentum fades and the same teases sellers.
In addition to the aforementioned support line near $1,780, the 100-SMA level surrounding $1,767 also acts as a short-term important level to watch for the Gold bears.
Meanwhile, the $1,800 threshold and the monthly high near $1,810 restrict the short-term upside of the XAU/USD.
However, a successful run-up beyond $1,810 won’t hesitate to aim for June’s top near $1,780.
Gold price: Four-hour chart
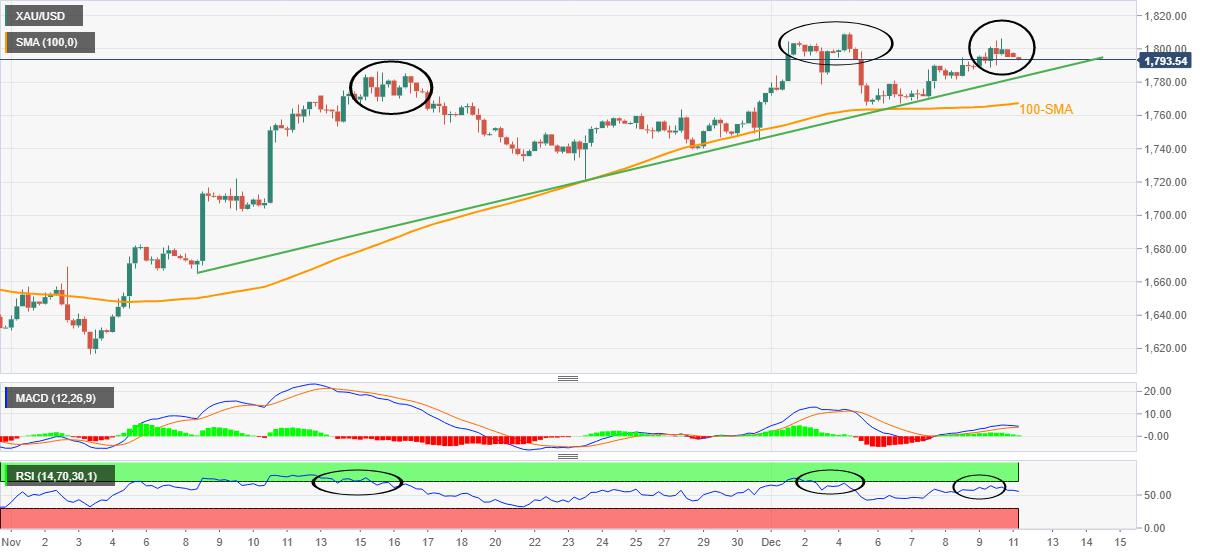
Trend: Further downside expected
Reprinted from FXStreet_id,the copyright all reserved by the original author.
Disclaimer: The content above represents only the views of the author or guest. It does not represent any views or positions of FOLLOWME and does not mean that FOLLOWME agrees with its statement or description, nor does it constitute any investment advice. For all actions taken by visitors based on information provided by the FOLLOWME community, the community does not assume any form of liability unless otherwise expressly promised in writing.
FOLLOWME Trading Community Website: https://www.followme.com


Hot
No comment on record. Start new comment.