WTI Price Analysis: Justifies bullish RSI divergence to regain $72.00

- WTI crude oil licks its wounds near the yearly low.
- Bearish MACD signals, key resistances challenge the black gold buyers.
- Three-week-old descending support line challenges further downside.
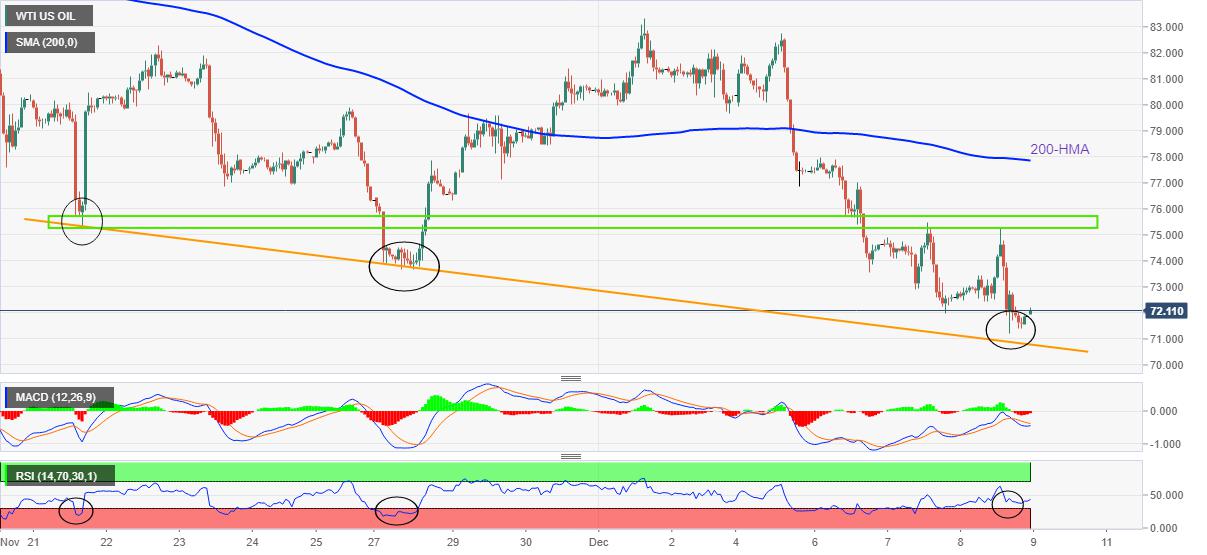
WTI crude oil picks up bids to pare weekly losses around the lowest levels in 2022 as bulls poke the $72.00 level during Friday’s Asian session. In doing so, the black gold prints the first daily gains in six while justifying a bullish divergence between the oil prices and the Relative Strength Index (RSI) line, placed at 14.
That said, the lower low of WTI contrasts with the higher low of the RSI line and teases the commodity buyers around the multi-day low.
However, the recovery moves need validation from the late November swing lows, around $73.70, to convince oil buyers.
Even so, a three-week-old horizontal region could challenge the quote’s further upside between $75.25 and $75.75.
Additionally, acting as an upside filter is the 200-HMA level surrounding $77.90 and the $78.00 threshold.
In a case where the energy benchmark rises past $78.00, the $80.00 could act as the last defense of bears.
Alternatively, a downward-sloping support line from late November, close to $70.80, acts as the immediate challenge for the WTI bears.
Following that, the $70.00 round figure and late December 2021 low near $66.00 could lure the commodity sellers.
WTI: Hourly chart
Trend: Limited recovery expected
Reprinted from FXStreet_id,the copyright all reserved by the original author.
Disclaimer: The content above represents only the views of the author or guest. It does not represent any views or positions of FOLLOWME and does not mean that FOLLOWME agrees with its statement or description, nor does it constitute any investment advice. For all actions taken by visitors based on information provided by the FOLLOWME community, the community does not assume any form of liability unless otherwise expressly promised in writing.
FOLLOWME Trading Community Website: https://www.followme.com


Hot
No comment on record. Start new comment.