NZD/USD Price Analysis: Tests the critical support of 0.6200

- China’s anti-Covid protest-inspired risk-off profile has weakened the New Zealand Dollar.
- The US yields have dropped amid anxiety ahead of Fed Powell’s speech.
- A momentum loss in the kiwi asset has been followed by a breakdown of 100-EMA.
The NZD/USD pair has dropped to a short-lived cushion around 0.6200 in the Tokyo session. China’s anti-Covid lockdown protests-inspired volatility has spooked the sentiment of market participants. In the currency domain, commodity-linked currencies have sensed immense selling pressure being a trading partner of China.
Meanwhile, the US Dollar Index (DXY) has tested a two-day high at 106.40 and is expected to sustain above the same. S&P500 futures have extended its losses further, portraying a risk-aversion theme. The 10-year US Treasury yields have tumbled below 3.65% amid anxiety ahead of a speech from Federal Reserve (Fed) chair Jerome Powell, which is due on Wednesday.
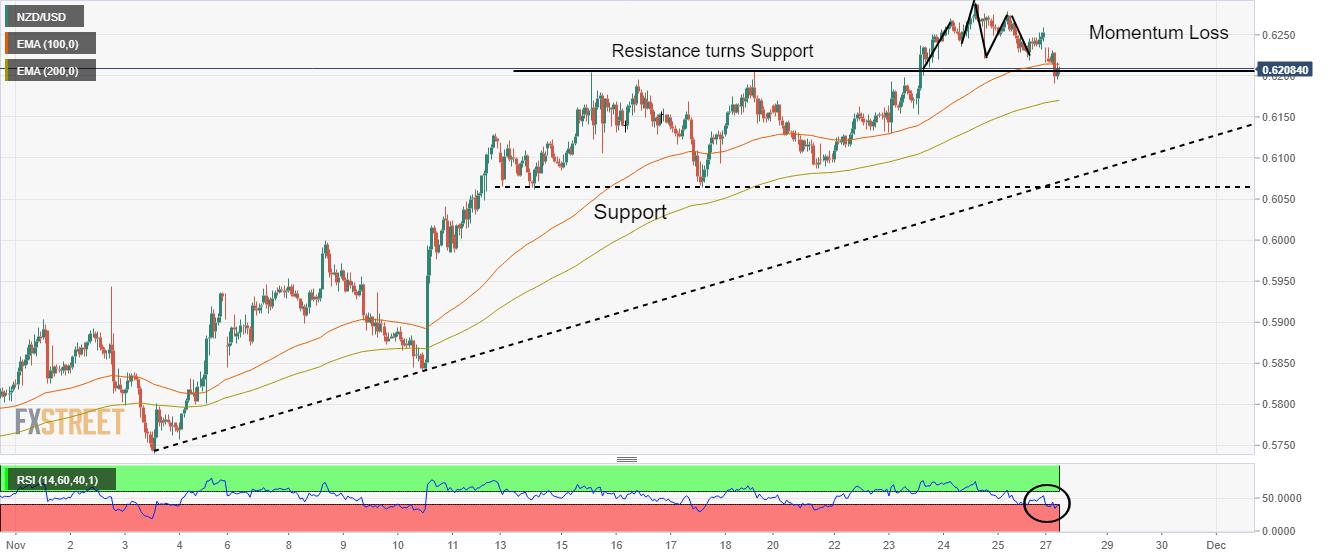
On an hourly scale, the Kiwi asset has dropped after facing a loss in the upside momentum. The major dropped to near the round-level support of 0.6200, which was a resistance earlier. The upward-sloping trendline from November 3 low at 0.5741 will continue to act as major support for the counter.
The Kiwi asset has dropped below the 100-period Exponential Moving Average (EMA) at 0.6215 while the 200-EMA at 0.6170 has not been challenged yet.
Meanwhile, the Relative Strength Index (RSI) (14) has slipped into the bearish range of 20.00-40.00, which indicates more weakness ahead.
Going forward, a drop below November 23 low at 0.6130 will drag the kiwi asset towards the horizontal support placed from November 13 low at 0.6074 and the psychological support at 0.6000.
On the flip side, a break above Friday’s high at 0.6278 will drive the major towards August 1 high at 0.6353, followed by the round-level resistance at 0.6400.
NZD/USD hourly chart
Reprinted from FXStreet_id,the copyright all reserved by the original author.
Disclaimer: The content above represents only the views of the author or guest. It does not represent any views or positions of FOLLOWME and does not mean that FOLLOWME agrees with its statement or description, nor does it constitute any investment advice. For all actions taken by visitors based on information provided by the FOLLOWME community, the community does not assume any form of liability unless otherwise expressly promised in writing.
FOLLOWME Trading Community Website: https://www.followme.com


Hot
No comment on record. Start new comment.