USDCAD Price Analysis: Recovery seeks validation from 50-DMA hurdle near 1.3500

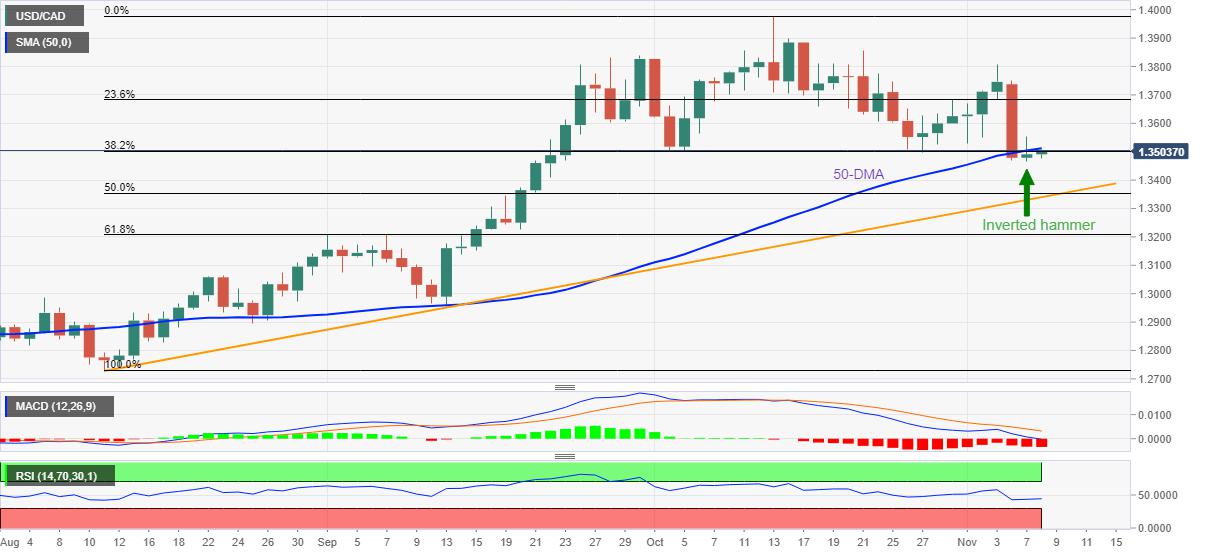
- USDCAD picks up bids to extend the previous day’s rebound from six-week low.
- Bearish MACD signals, steady RSI keep sellers hopeful.
- Buyers can return unless breaking 1.3340, inverted hammer challenges bearish bias.
USDCAD extends the week-start rebound to 1.3510 during early Tuesday morning in Europe.
In doing so, the Loonie pair justifies the previous day’s “inverted hammer” bullish candlestick while poking the 50-DMA hurdle.
It should be noted, however, that the Loonie pair’s sustained break of a one-month-old horizontal area surrounding 1.3500 during the last week joins the bearish MACD signals to suggest the quote’s underlying weakness in momentum.
Hence, the latest rebound appears elusive unless the quote provides a daily closing beyond the 50-DMA hurdle surrounding 1.3515.
Following that, a gradual run-up toward s1.3610 and 1.3720 can’t be ruled out. However, multiple hurdles around 1.3840-50 could challenge the USDCAD bulls afterward.
Meanwhile, fresh sellers could wait for the quote’s downside break of the latest swing low, around 1.3465.
Following that, a convergence of the 50% Fibonacci retracement level of the pair’s August-October upside and a three-month-old ascending support line, surrounding 1.3350-40, will be crucial to watch for the USDCAD bears.
Should the quote provides a daily closing below 1.3340, the odds of witnessing a slump toward the early September highs near 1.3210 can’t be ruled out. Adding strength to the said support is the 61.8% Fibonacci retracement level, also known as the golden ratio.
USDCAD: Daily chart
Trend: Limited upside expected
Reprinted from FXStreet_id,the copyright all reserved by the original author.
Disclaimer: The content above represents only the views of the author or guest. It does not represent any views or positions of FOLLOWME and does not mean that FOLLOWME agrees with its statement or description, nor does it constitute any investment advice. For all actions taken by visitors based on information provided by the FOLLOWME community, the community does not assume any form of liability unless otherwise expressly promised in writing.
FOLLOWME Trading Community Website: https://www.followme.com


Hot
No comment on record. Start new comment.