EUR/JPY Price Analysis: Well-set for further downside below 146.00

- EUR/JPY breaks five-week-old support line during three-day downtrend.
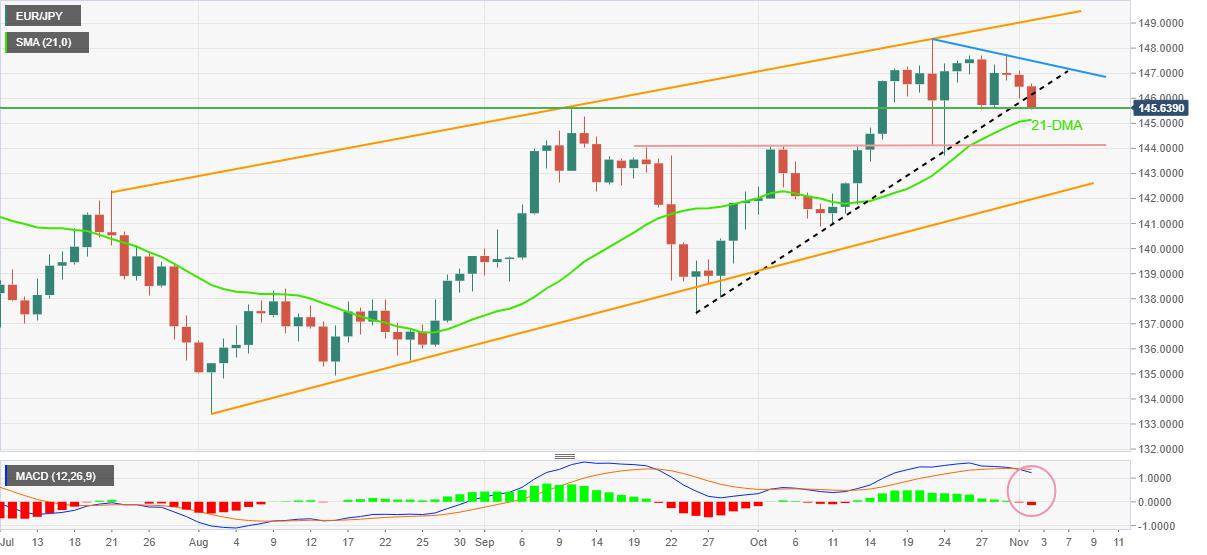
- MACD prints the biggest bearish signal in a month.
- A daily closing below September’s peak becomes necessary for the buyers to leave the table.
EUR/JPY drops half a percent as the bears keep reins around 145.80, down for the third consecutive day to early Wednesday morning in Europe.
The cross-currency pair’s latest weakness could be linked to the seller’s ability to conquer an upward-sloping support line from September 26, now resistance around 146.15. Also adding strength to the downside bias is the strongest bearish MACD signal since October 03.
That said, the EUR/JPY pair’s further downside needs to provide a daily closing below September’s peak of 145.63 to keep the sellers hopeful. Also acting as a downside filter is the 21-DMA level surrounding 145.15.
In a case where the quote remains bearish below 145.15, the odds of its south-run towards 144.10-00 area comprising tops marked since October 20 can’t be ruled out.
Alternatively, recovery moves need a daily close beyond the support-turned-resistance line around 146.15.
Even so, a descending trend line from October 21, close to 147.50 by the press time, will act as the last defense of the bears.
Should the EUR/JPY prices remain firmer past 147.50, the previous monthly high of 148.40 and the upper line of a 3.5-month-old bullish channel, around 149.10, will be in focus.
EUR/JPY: Daily chart
Trend: Further downside expected
Reprinted from FXStreet_id,the copyright all reserved by the original author.
Disclaimer: The content above represents only the views of the author or guest. It does not represent any views or positions of FOLLOWME and does not mean that FOLLOWME agrees with its statement or description, nor does it constitute any investment advice. For all actions taken by visitors based on information provided by the FOLLOWME community, the community does not assume any form of liability unless otherwise expressly promised in writing.
FOLLOWME Trading Community Website: https://www.followme.com


Hot
No comment on record. Start new comment.