GBP/JPY Price Analysis: Trimmed last week’s losses, regains the 200-DMA

- GBP/JPY registered hefty gains of 3.96% during the week.
- Long-term, the GBP/JPY is neutral upwards, though if it clears 162.57, that could open the door for further gains.
- Per the daily chart, if the GBP/JPY clears 162.25, the pair can rally towards 164.00.
The GBP/JPY advanced for the fourth straight day and reclaimed the 200-day EMA after hitting a daily low at around 159.43, though buyers stepped, sending the cross-currency pair towards its daily high of 162.17. At the time of writing, the GBP/JPY is trading at 161.54, above its opening price by 0.62%.
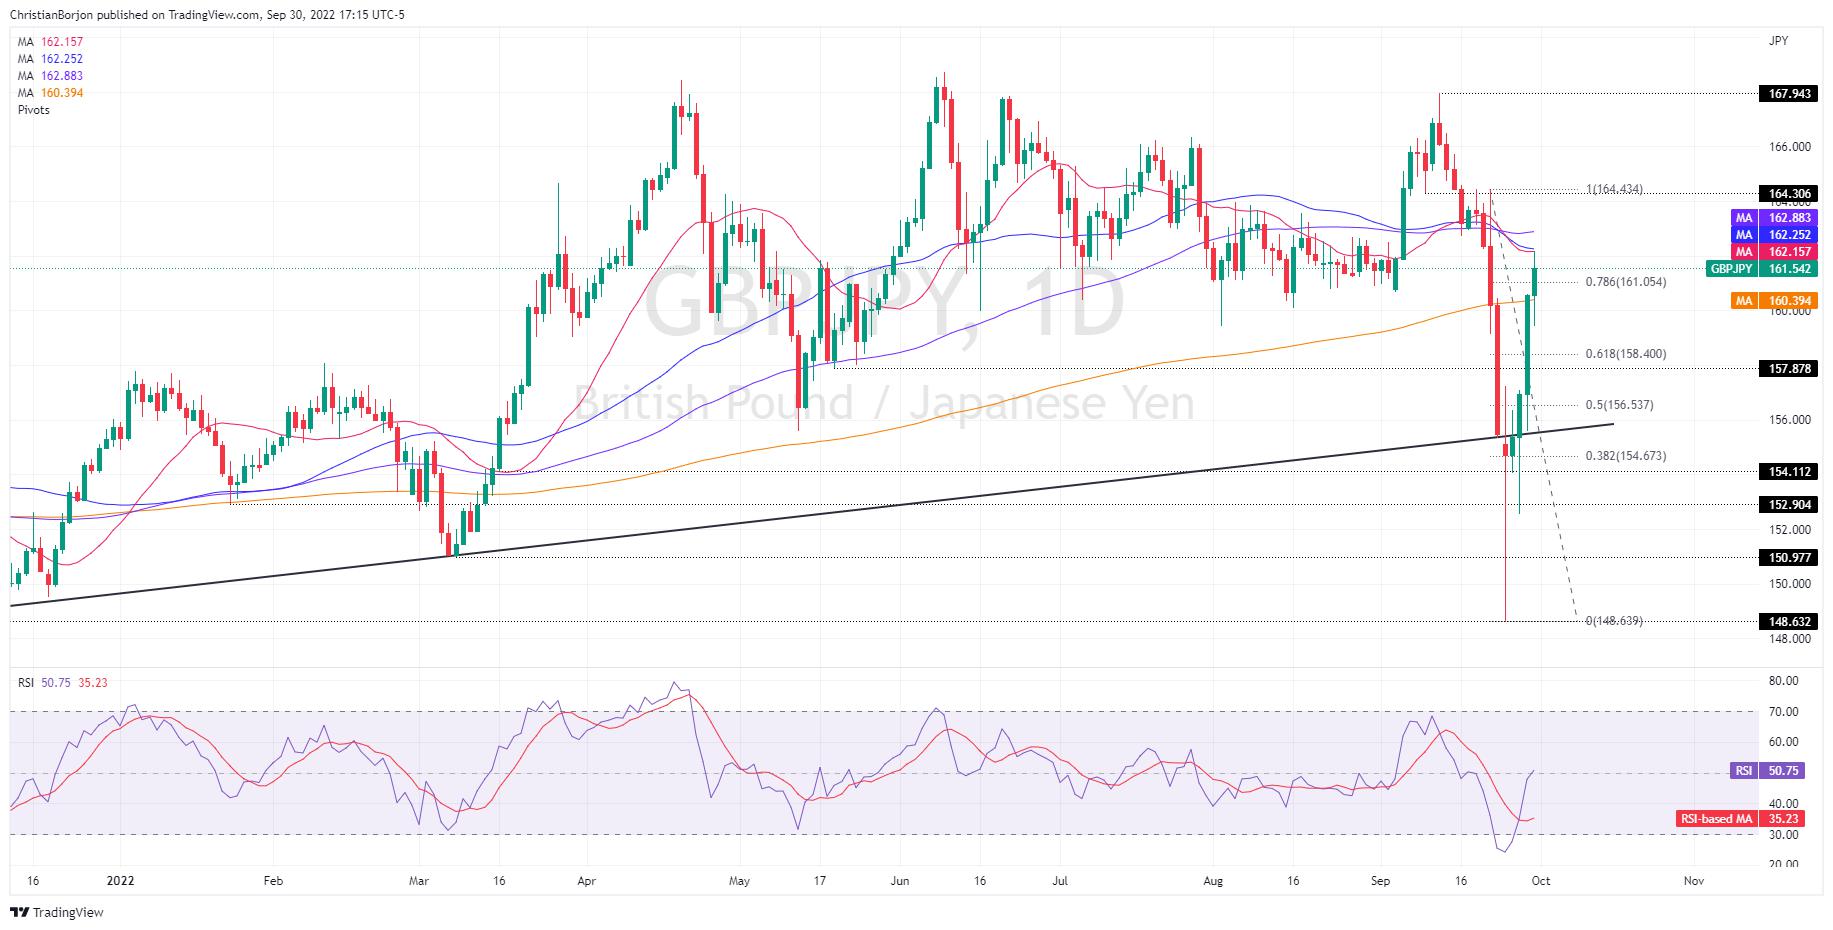
GBP/JPY Price Analysis: Technical outlook
From a weekly chart perspective, the GBP/JPY is neutral-to-upward biased after a volatile trading week that witnessed the pound sliding towards a YTD low of 148.63 before recovering close to 1200 pips. GBP/JPY traders should be aware of oscillators shifting to positive territory. Therefore, a re-test of the 20-week EMA, around 162.57, is on the cards.
The GBP/JPY daily chart shows that Friday’s rally was capped at a “packed” supply zone, with the 20, and the 50-day EMAs hoovering around 162.15-162.25, ahead of the 100-day EMA at 162.88. Worth noting that, albeit solid resistance lie above, the GBP/JPY pierced the 78.6% Fibonacci retracement at 161.05, opening the door for further upside.
Therefore, the GBP/JPY first resistance would be the 162.00 figure. Once cleared it would expose the aforementioned 162.15-162.25 area, followed by the 100-day EMA at 162.88 ahead of the 163.00 mark. A breach of the latter will expose the September 22 daily high at 164.43.
GBP/JPY Key Technical Levels
Reprinted from FXStreet,the copyright all reserved by the original author.
Disclaimer: The content above represents only the views of the author or guest. It does not represent any views or positions of FOLLOWME and does not mean that FOLLOWME agrees with its statement or description, nor does it constitute any investment advice. For all actions taken by visitors based on information provided by the FOLLOWME community, the community does not assume any form of liability unless otherwise expressly promised in writing.
FOLLOWME Trading Community Website: https://www.followme.com


Hot
No comment on record. Start new comment.