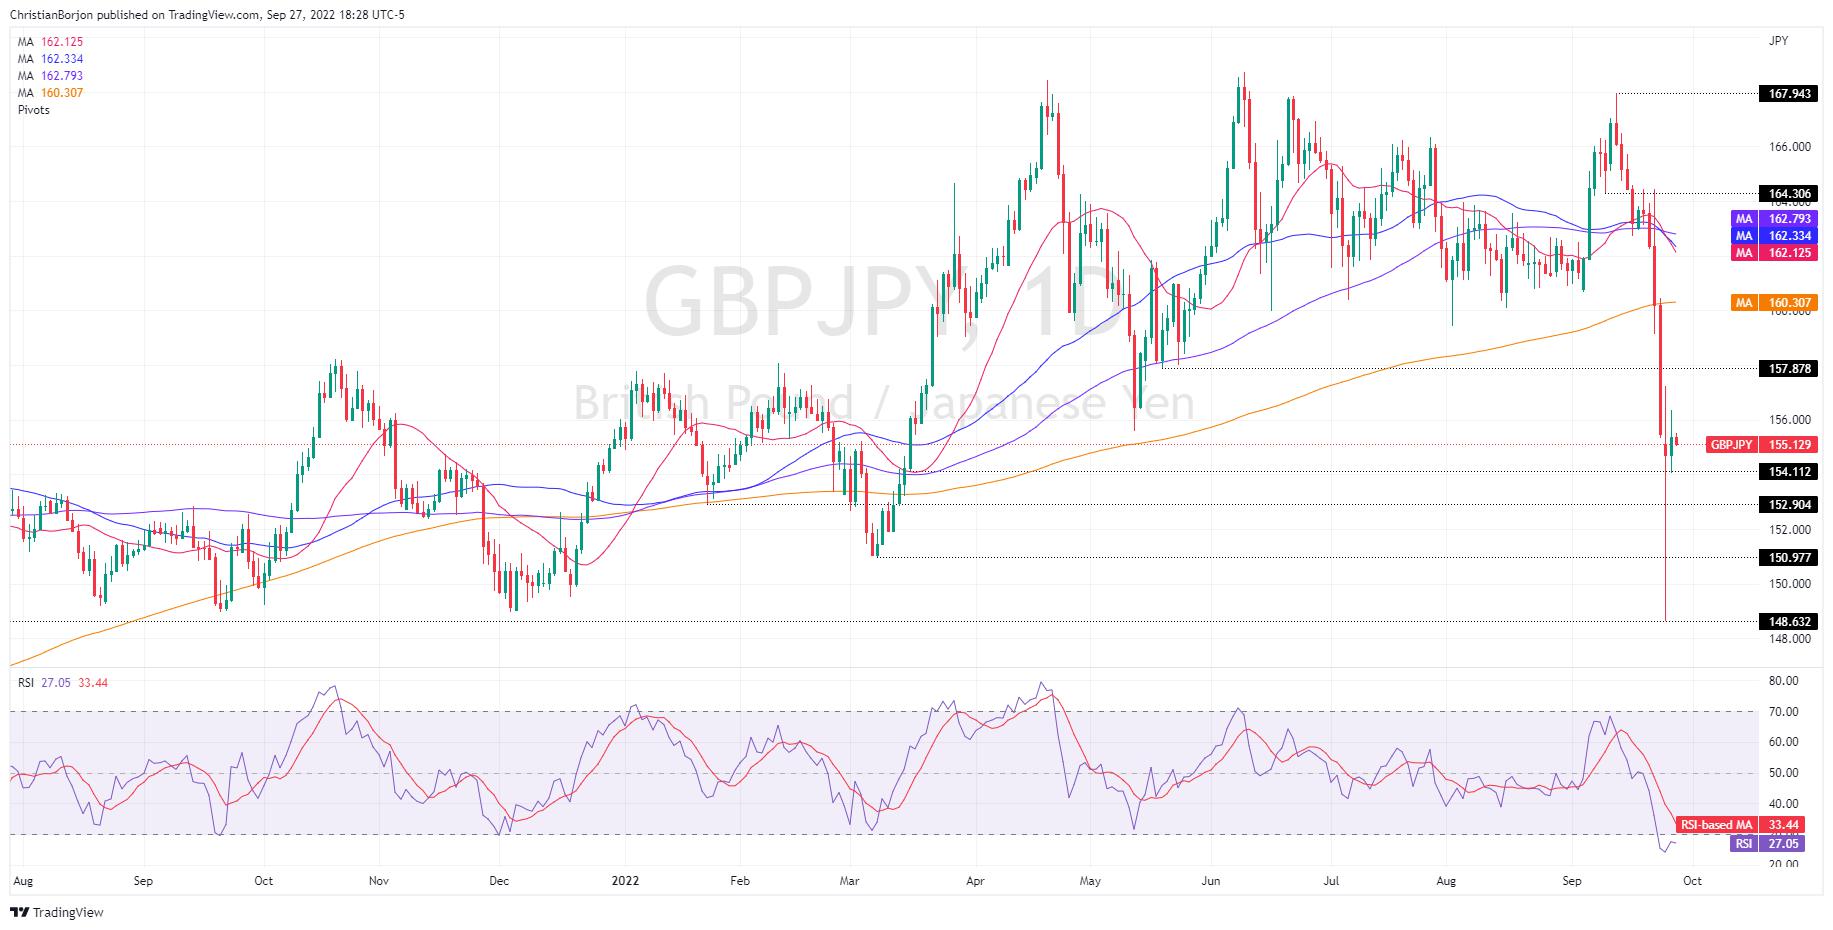
GBP/JPY Price Analysis: Fluctuates around 155.00 as a bullish harami form, targeting the 200-DMA

- GBP/JPY trims some Monday losses and hovers above the 155.00 figure.
- The daily chart portrays the pair as downward biased, though a “bullish-harami” candle pattern could open the door for a re-test of the 200-day EMA.
- If the GBP/JPY clears the 154.00 figure, it could send the pair towards the daily low at 148.53.
The GBP/JPY recovered some ground on Tuesday courtesy of a slight improvement in sentiment, though, in the end, US equities finished in the red, while Asian bourses are set for a lower open as risk aversion got back. At the time of writing, the GBP/JPY is trading at 155.12
GBP/JPY Price Analysis: Technical outlook
The GBP/JPY daily chart shows the pair remains bearish-biased once it cleared the 200-day EMA. Tuesday’s price action completed a “bullish harami” candle pattern, suggesting that the GBP/JPY might be headed upwards. Nevertheless, due to Monday’s volatile trading session, the GBP/JPY could trim some of its losses but would need to surpass some resistance levels on its way north.
Therefore, the GBP/JPY’s first resistance would be the September 27 daily high at 156.36. The break above will expose the September 26 high at 157.22, followed by the 200-day EMA at 160.30. If buyers surpass the latter, that would shift the bias to neutral and open the door for further gains.
On the flip side, the GBP/JPY’s first support will be the September 27 daily low at 154.07. Once cleared, the next demand zone would be the January 24 daily low at 152.90, followed by a re-test of the YTD low at 148.53, ahead of the September 2020 cycle high of 142.70.
GBP/JPY Key Technical Analysis
Reprinted from FXStreet,the copyright all reserved by the original author.
Disclaimer: The content above represents only the views of the author or guest. It does not represent any views or positions of FOLLOWME and does not mean that FOLLOWME agrees with its statement or description, nor does it constitute any investment advice. For all actions taken by visitors based on information provided by the FOLLOWME community, the community does not assume any form of liability unless otherwise expressly promised in writing.
FOLLOWME Trading Community Website: https://www.followme.com


Hot
No comment on record. Start new comment.