EUR/USD Price Analysis: Bears retain control at two-decade low

- EUR/USD pares intraday losses after refreshing 20-year low.
- Six-month-old bearish channel, clear downside break of two-month-long support line favor bears.
- Oversold RSI conditions, descending support line from late July tests sellers.
- Recovery remains elusive below the parity level, early 2001 levels may offer extra downside filters.
EUR/USD dropped to the lowest levels since June 2002 before recently bouncing back to 0.9660 during Monday’s Asian session. Even so, the bearish chart formation and sustained trading below the previous key support line from July, now resistance around 0.9830, keeps the pair sellers hopeful.
That said, the recovery moves towards the 0.9830 hurdle can also take clues from the recently oversold RSI (14).
However, the EUR/USD bulls will have to cross the upper line of the bearish channel from March, around 1.0015 by the press time, to convince the buyers to take entry.
Following that, a run-up towards the monthly high near 1.0200 can’t be ruled out.
Alternatively, a daily closing below the downward sloping trend line from July 27, at 0.9640 by the press time, could revisit the January 2001 peak surrounding 0.9600 before dropping towards the support line of the aforementioned channel near 0.9480.
Overall, EUR/USD bears keep the reins but the corrective pullback towards 0.9830 can’t be ruled out.
EUR/USD: Daily chart
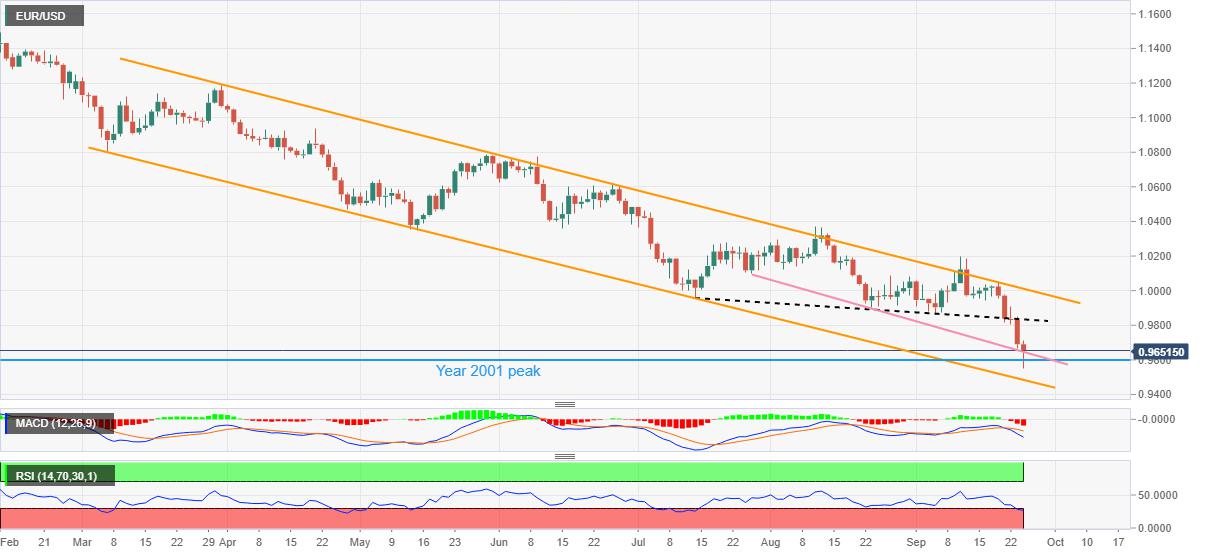
Trend: Bearish
Reprinted from FXStreet_id,the copyright all reserved by the original author.
Disclaimer: The content above represents only the views of the author or guest. It does not represent any views or positions of FOLLOWME and does not mean that FOLLOWME agrees with its statement or description, nor does it constitute any investment advice. For all actions taken by visitors based on information provided by the FOLLOWME community, the community does not assume any form of liability unless otherwise expressly promised in writing.
FOLLOWME Trading Community Website: https://www.followme.com


Hot
No comment on record. Start new comment.