WTI recovers from five-month-lows climbs above $82.50

- On Thursday, WTI is advancing 1%, snapping two straight days of losses.
- China’s Covid-19 lockdowns, US oil inventories growing, and Russia’s halting oil and natural-gas flows could bolster WTI prices.
- WTI Price Analysis: Risks are skewed to the downside, but buyers reclaiming $86.00, could pave the way for higher prices.
US crude oil, also known as WTI, advances 1% during Thursday’s trading session after diving to a seven-month-old low at around $81.27 per barrel due to Russia’s halting oil and natural gas exports to some “unfriendly” buyers, while European’s energy crises worsen. At the time of writing, WTI is trading at $82.76, above its opening price.
Factors like China’s Covid-19 concerns, while US stockpiles surprisingly building more than estimates, were only two factors driving the price of the black gold down. Additionally, the US Biden administration is weighing another release of the US Strategic Petroleum Reserve (SPR).
On Wednesday, WTI plunged more than 5%, with Western Texas Intermediate (WTI) testing February’s 2022 lows. Nevertheless, even though initially the price dropped further on Thursday, it bounced off towards the daily highs at $84.24 PB before retracing to current levels.
Sources cited by Reuters attributed the jump in prices to an “oversold technical condition,” which allowed oil to shrug off news of the US stockpiles building, which accounted for nearly 9 million in the last week.
In the meantime, tensions between Europe and Russia keep energy investors uneasy. As the European Union proposed to put a lid on Russia’s oil, Russian President Vladimir Putin threatened to cut off all energy supplies if they advanced toward that path.
WTI Price Analysis: Technical outlook
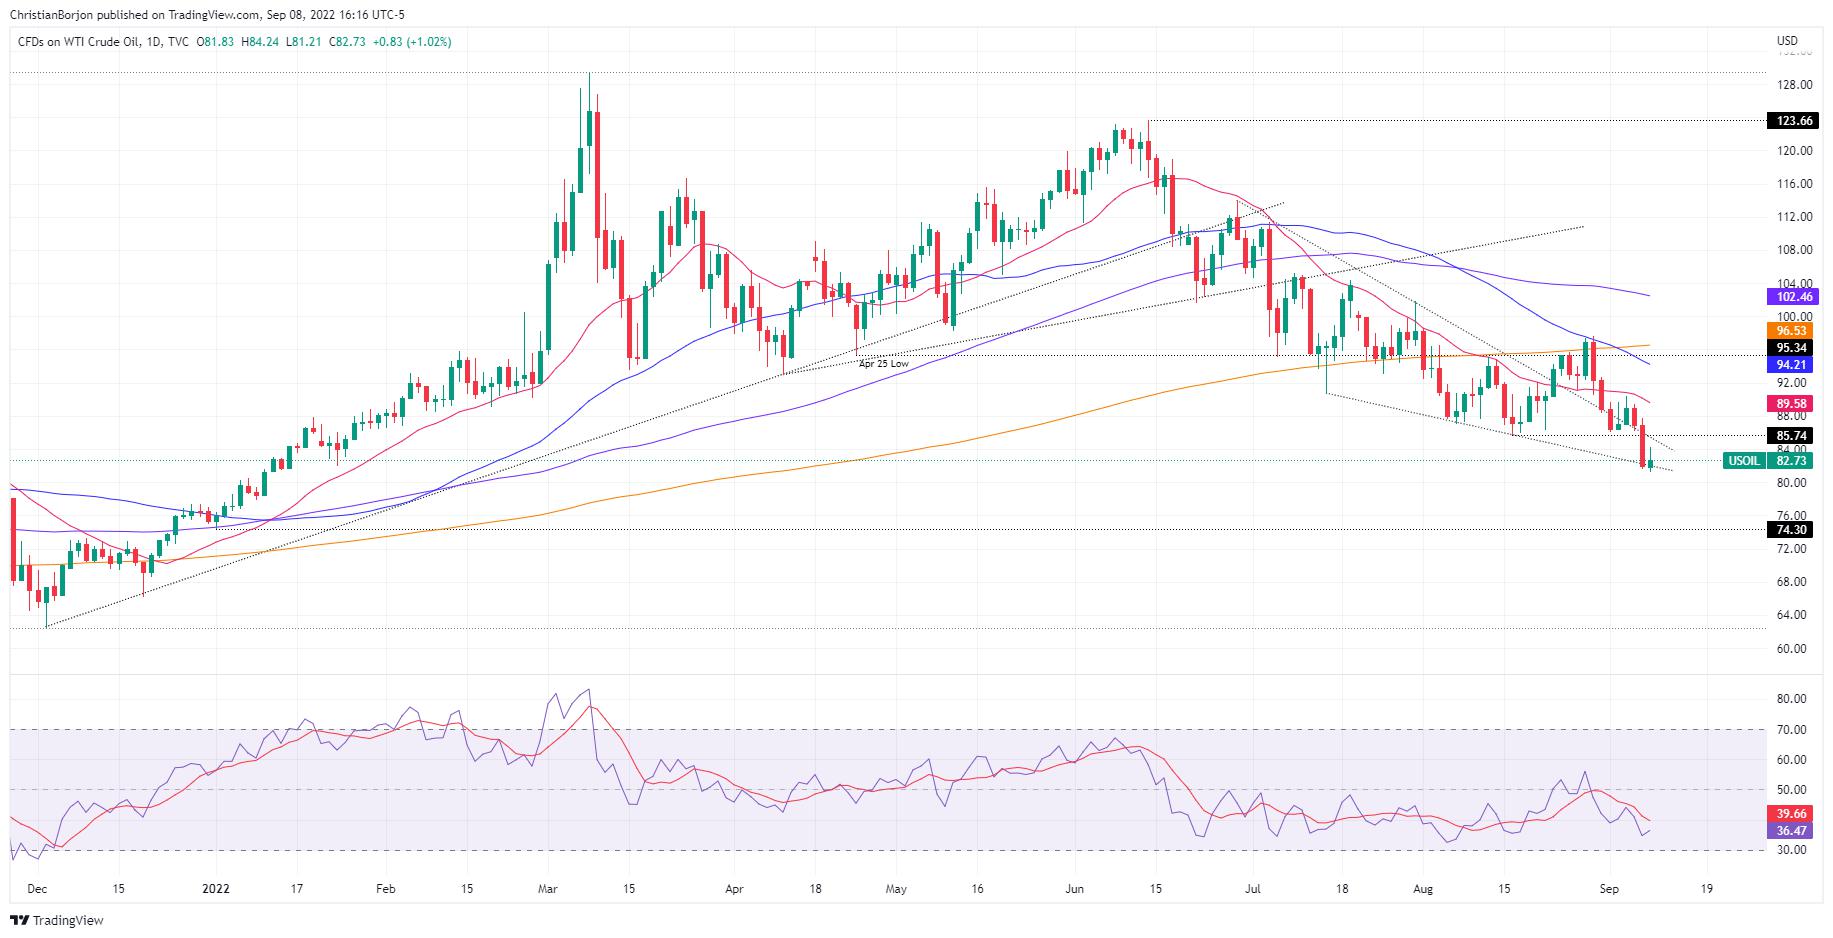
Oil’s daily chart depicts the black gold as downward biased, despite bouncing from five-month lows. Unless buyers lift prices above the August 16 low-turned-resistance at $85.74 PB, risks are skewed to the downside. If WTI reclaims the latter, a test of the 20-day EMA at $89.58 is on the cards.
On the flip side, WTI’s first support would be the YTD low at $81.27. The break below will expose the $80.00 figure, followed by the January 2 daily low at $74.30.
Reprinted from FXStreet_id,the copyright all reserved by the original author.
Disclaimer: The content above represents only the views of the author or guest. It does not represent any views or positions of FOLLOWME and does not mean that FOLLOWME agrees with its statement or description, nor does it constitute any investment advice. For all actions taken by visitors based on information provided by the FOLLOWME community, the community does not assume any form of liability unless otherwise expressly promised in writing.
FOLLOWME Trading Community Website: https://www.followme.com


Hot
No comment on record. Start new comment.