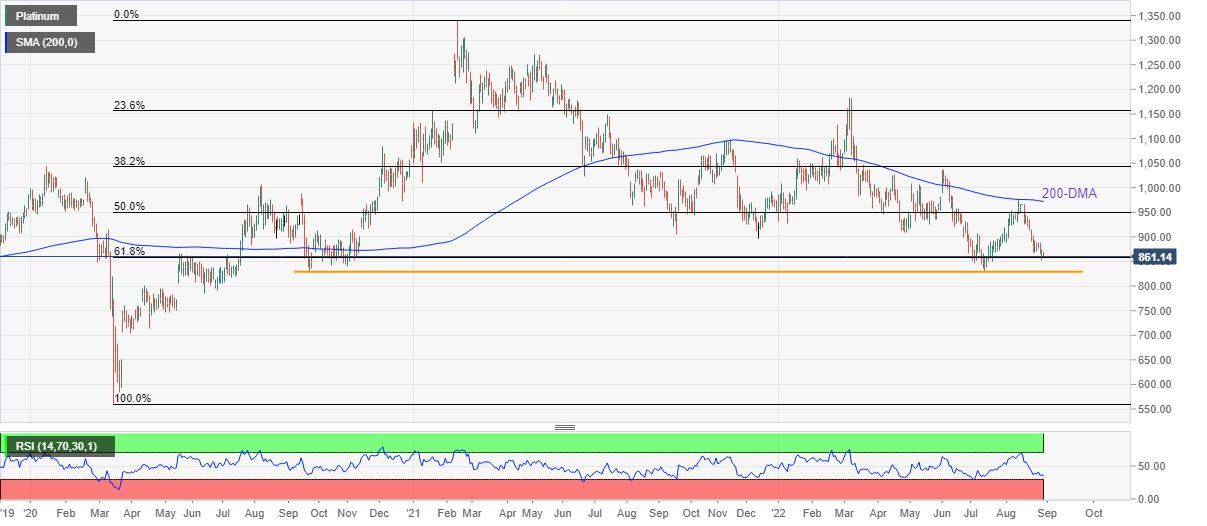
Platinum Price Analysis: XPT/USD stays on the way to $830-29 support zone

- Platinum price fades bounce off six-week low as sellers keep reins below 200-DMA.
- 61.8% Fibonacci retracement lures bears ahead of the key 23-month-old horizontal support.
- Nearly oversold RSI hints at limited downside room.
Platinum price (XPT/USD) holds lower grounds near $860 amid the early Tuesday morning in Europe. That said, the precious metal bounced off a 1.5-month low the previous day but couldn’t keep buyers on the board.
Given the quote’s sustained weakness below the 200-DMA, around $972.00 by the press time, XPT/USD is likely to remain pressured around the 61.8% Fibonacci retracement level of March 2020 to February 2021 upside, near $858.00.
In a case where bears manage to conquer the $858.00 support, the horizontal area comprising lows marked during September 2020 and in July 2022 could challenge the platinum bears around $830-29.00.
It should be noted that the XPT/USD south-run past $830.00 could make it vulnerable to breaking the $800 threshold while targeting June 2020 lows around $784.00.
Meanwhile, recovery remains elusive until the quote stays below the 200-DMA level surrounding $972.00, a break of which will propel the quote towards the $1,000 psychological magnet.
Even so, nearly oversold RSI might trigger the XPT/USD rebound targeting April’s swing low near $910.00.
To sum up, platinum is likely to remain on the bear’s radar unless crossing the 200-DMA. However, RSI approaches oversold territory and hints at a limited downside room.
Platinum: Daily chart
Trend: Limited downside expected
Reprinted from FXStreet_id,the copyright all reserved by the original author.
Disclaimer: The content above represents only the views of the author or guest. It does not represent any views or positions of FOLLOWME and does not mean that FOLLOWME agrees with its statement or description, nor does it constitute any investment advice. For all actions taken by visitors based on information provided by the FOLLOWME community, the community does not assume any form of liability unless otherwise expressly promised in writing.
FOLLOWME Trading Community Website: https://www.followme.com


Hot
No comment on record. Start new comment.