GBP/JPY Price Analysis: Drops below the 20-DMA as sellers eye the 100-DMA

- GBP/JPY exchanges hands around familiar levels, above 163.00.
- From a long-term perspective, the cross is neutrally biased, waiting for a catalyst.
- The GBP/JPY hourly chart is neutral-biased but tilted downwards as sellers gather momentum, as shown by the RSI.
The GBP/JPY seesaws during the North American session amidst a dull trading day. Investors are bracing for the release of US inflation data, which would be scrutinized by them, aiming to predict the next move of the FOMC in the September meeting. At the time of writing, the GBP/JPY is trading at 163.15.
The market sentiment is downbeat. US equities are trading with losses, while in the FX space, safe-haven peers begin to recover some ground, except for the US dollar. The GBP/JPY is trading near its opening price, after bouncing from daily lows at 162.62, before hitting the daily high at 163.67. However, risk aversion weighed on the pound, so the cross dived.
GBP/JPY Price Analysis: Technical outlook
From a daily chart perspective, the GBP/JPY is neutral-biased. For the second straight day, buyers’ inability to breach the 20-day EMA at 136.64 increased selling pressure in the cross, with bears piling around the 163.60 area, pushing the exchange rate towards the 163.00 figure.
Hence, the GBP/JPY’s first support would be the August 8 low at 162.56. The break below will expose the August 5 low at 161.11, followed by the August 2 swing low at 159.44. Otherwise, if buyers reclaim the 20-day EMA at 163.64, that would open the door for a test of the 50-day EMA at 164.21.
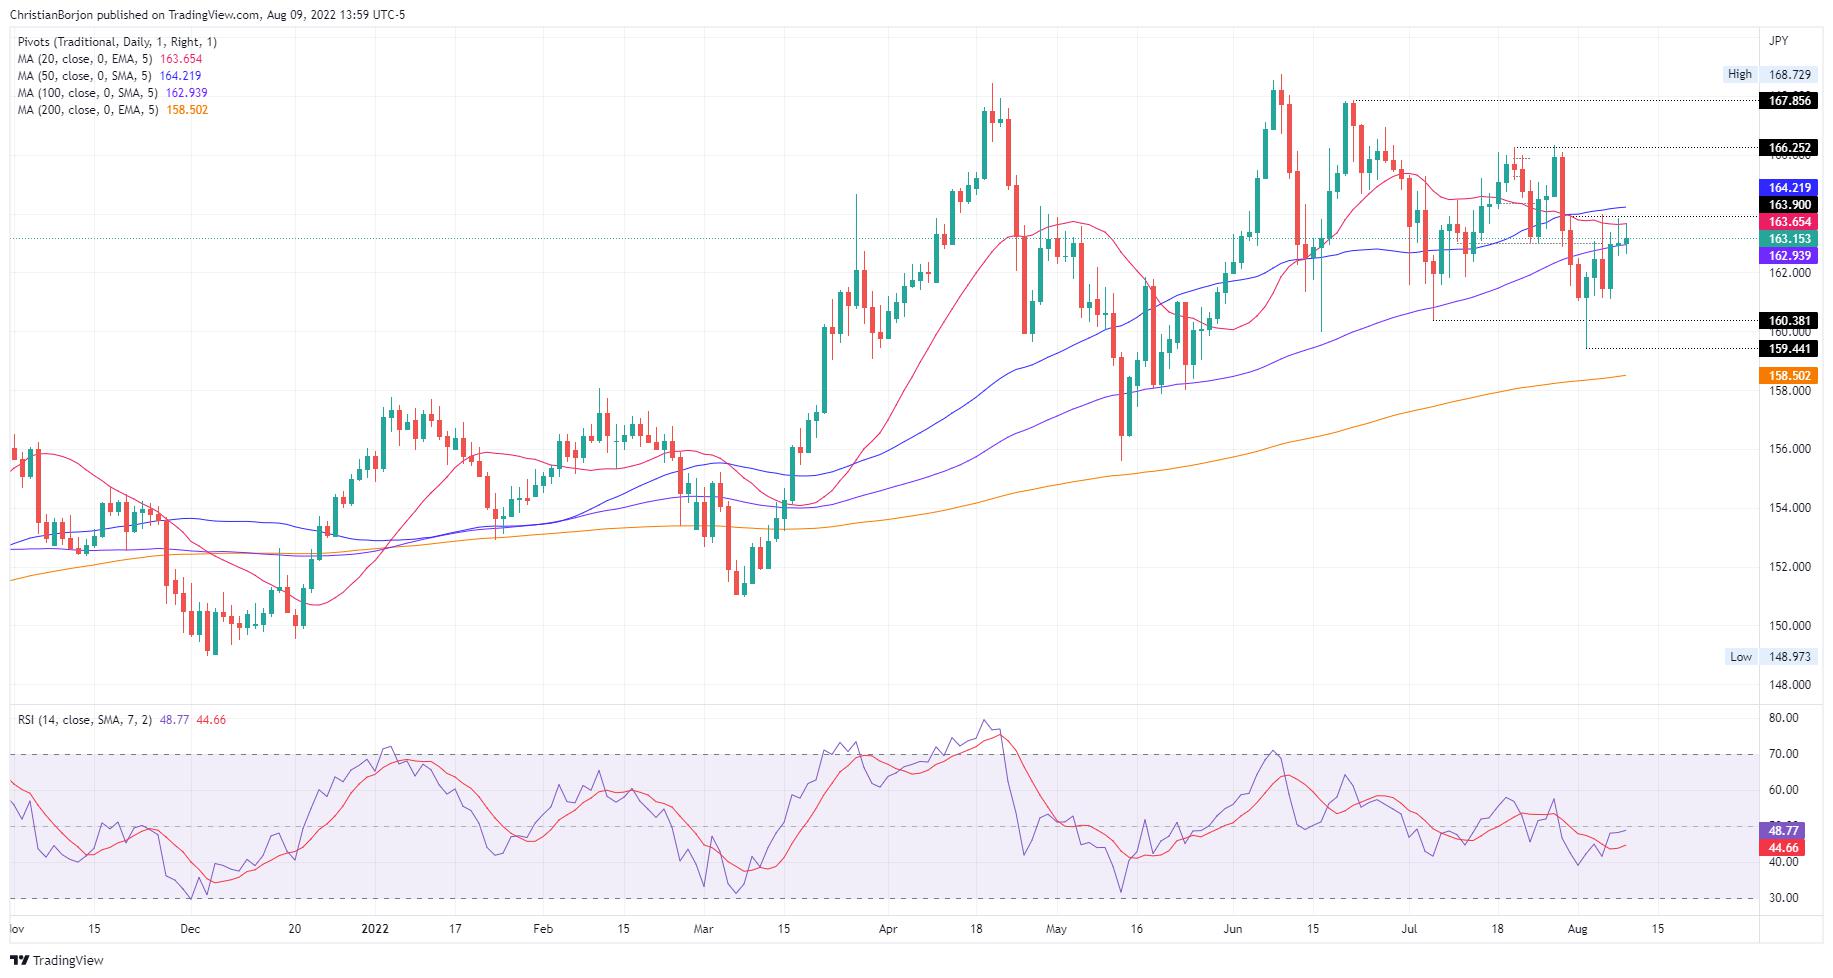 GBP/JPY Daily chart
In the one-hour scale, the GBP/JPY is neutral biased, trapped within the 161.11-163.84 area. However, the Relative Strength Index (RSI) shows that sellers are gathering momentum, with the RSI at 47.26 and crossing below the 7-RSI SMA, meaning that bears are in control. Therefore, the GBP/JPY first support would be the 100-hour EMA at 162.68. Once cleared, the next support would be the S2 pivot point at 162.43, followed by the S1 daily pivot at 161.85. On the flip side, a break above 163.84 could send the pair towards the August 4 high at 163.97, which, once cleared, could open the door for further gains
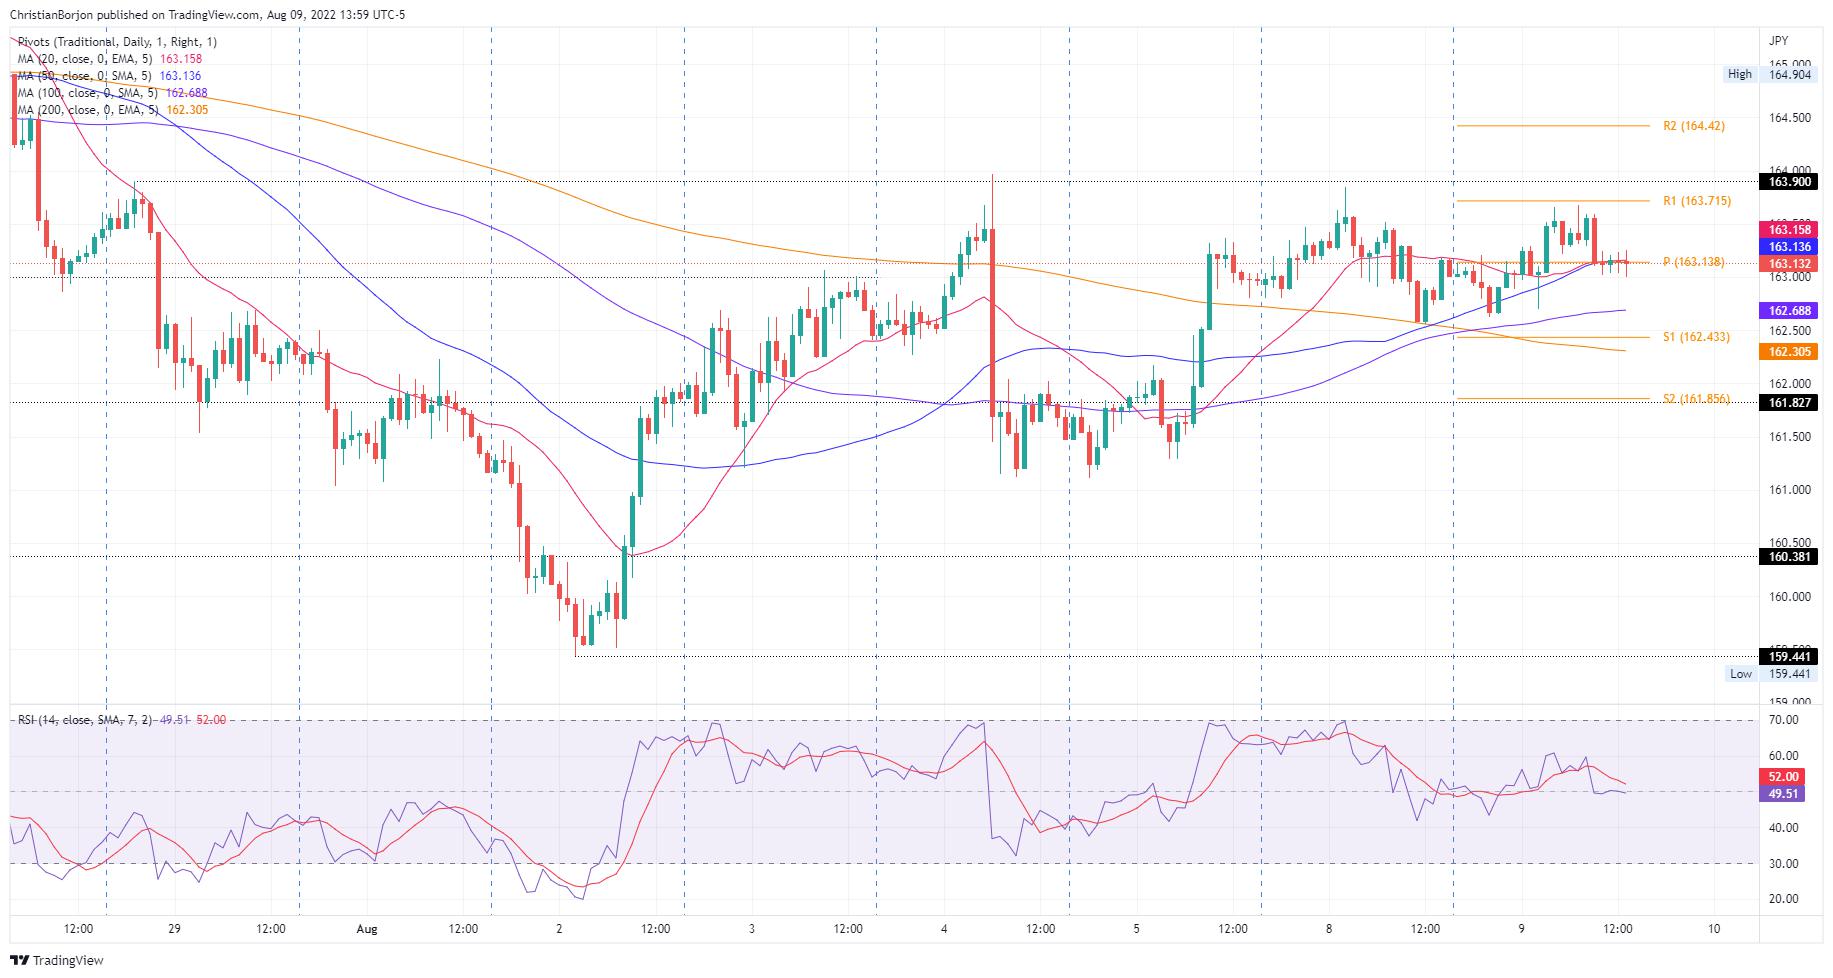 GBP/JPY Hourly chart
GBP/JPY Key Technical Levels
Reprinted from FXStreet,the copyright all reserved by the original author.
Disclaimer: The content above represents only the views of the author or guest. It does not represent any views or positions of FOLLOWME and does not mean that FOLLOWME agrees with its statement or description, nor does it constitute any investment advice. For all actions taken by visitors based on information provided by the FOLLOWME community, the community does not assume any form of liability unless otherwise expressly promised in writing.
FOLLOWME Trading Community Website: https://www.followme.com


Hot
No comment on record. Start new comment.