USD/CAD Price Analysis: Selling pressure mounts around 1.2780s as bears eye for a break below the 100-DMA

- The Canadian dollar is recording goodish gains in the week of 0.85%.
- A positive market sentiment boosted the appetite for high-beta currencies, like the CAD.
- USD/CAD Price Forecast: To face solid support around 1.2694-1.2700.
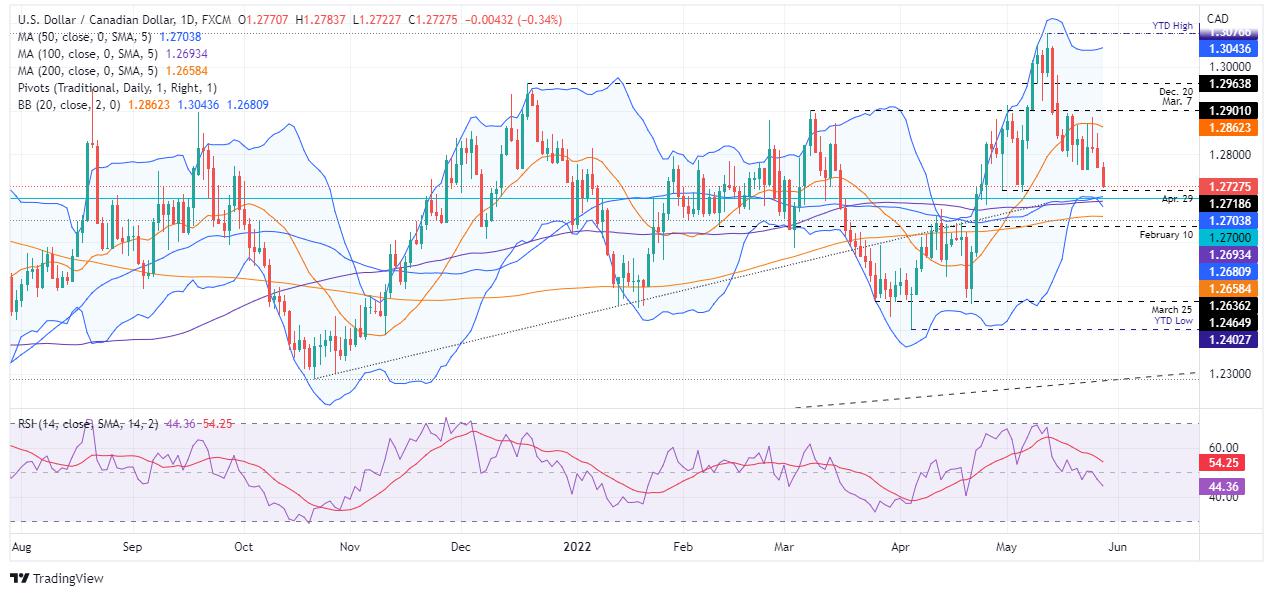
The USD/CAD edges lower in the North American session, extending its weekly losses for the third consecutive week as investors shrugged off an “aggressive” US Federal Reserve, as Core PCE rose to 4.9% but ticked down from 5.1% YoY. At the time of writing, the USD/CAD is trading at 1.2727.
US equities remain positive, reflecting a risk-on mood. The S&P 500 is about to erase its May losses, as the US Commerce Department informed that inflation increased at a slower pace than in March. Will the Fed slow the pace of hiking rates after reaching the 2% threshold?
Although inflation is heading lower, ING analysts noted that some factors lurk in the economic environment. First, the geopolitical backdrop keeps pushing energy prices higher. Second, China’s zero-covid policy slowed down the improvement in the supply chains, and thirdly, the tight labor market needs to mitigate a wage-price spiral.
Elsewhere, the USD/CAD on Friday began trading near the day’s highs at 1.2784 but slid towards three-week new lows around the 1.2720 area.
USD/CAD Price Forecast: Technical outlook
USD/CAD remains upward biased, though its two-week downtrend will face a solid support area in the 50 and the 100-day moving averages (DMAs), around the 1.2704-1.2693 area. Nevertheless, USD/CAD bulls need to be careful and not overconfident that the aforementioned level would hold. Why? The Relative Strength Index (RSI) at 44.29 is aiming lower, well within bearish territory, and with enough space before reaching oversold conditions.
If the USD/CAD two-week downtrend extends, the major’s first support would be the 1.2693-1.2704 area. Break below would expose the 200-DMA at 1.2658, followed by the April 22 low at 1.2566. On the flip side, the USD/CAD first resistance would be 1.2800. Once cleared, the following supply region would be the 20-DMA at 1-2862, followed by the March 8 high at.1.2901.
Key Technical Levels
Reprinted from FXStreet,the copyright all reserved by the original author.
Disclaimer: The content above represents only the views of the author or guest. It does not represent any views or positions of FOLLOWME and does not mean that FOLLOWME agrees with its statement or description, nor does it constitute any investment advice. For all actions taken by visitors based on information provided by the FOLLOWME community, the community does not assume any form of liability unless otherwise expressly promised in writing.
FOLLOWME Trading Community Website: https://www.followme.com


Hot
No comment on record. Start new comment.