S&P 500: The market is likely due for a pullback or decline

Recap 5/17 – Tuesday, the S&P gapped open up 44 handles and then rallied another 18 handles into a 9:30 AM high. From that high, the S&P declined 36 handles into a 10:46 AM low of the day. From that low, the S&P rallied 47 handles into a 2:08 PM high. From that high, the S&P declined 38 handles into a 2:23 PM low. From that low, the S&P rallied 48 handles into a 3:22 PM high of the day. From that high, the S&P dipped 15 handles into a 3:49 PM low. From that low, the S&P rallied 13 handles into the close.
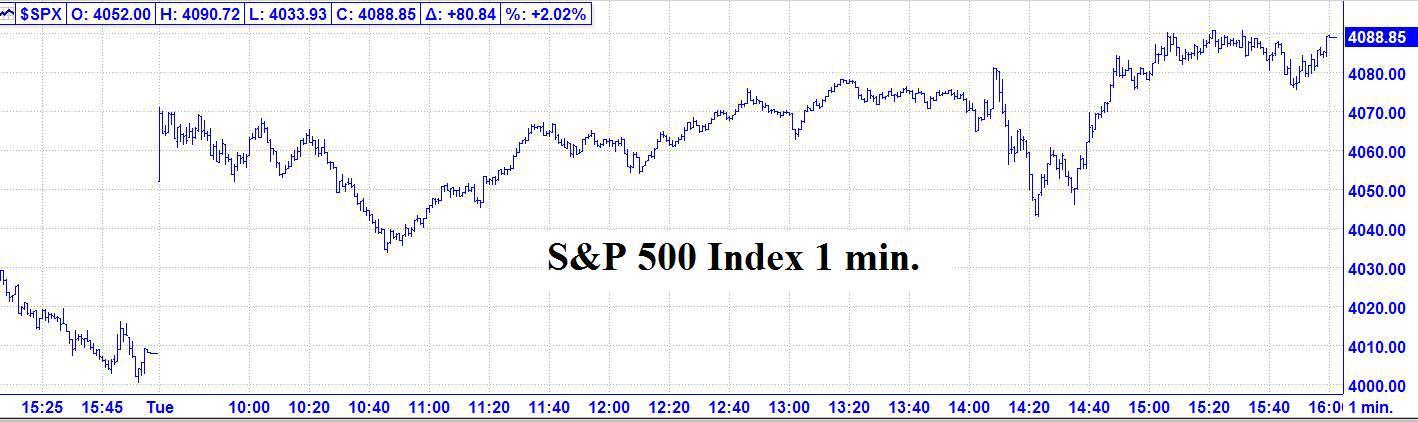
5/17 – The major indices, had a huge up day and finished per the following closes: DJIA + 431.17; S&P 500 + 80.84; and the Nasdaq Composite + 321.73.
Looking ahead – Given we allow one trading day for our change in trend points, last chance for a high from Mercury 0 South Latitude is Wednesday first half hour. In fact, that may have manifested itself on Monday’s low. However, given the muddled picture, I already recommend that you get out if the market did not turn down during Tuesday AM. On another front, please see my technical comments on the S&P 500 below.
For the next few days, the planets are taking a break. Our next change in trend point is a Market Math date of 5/19.
The Now Index is in the NEUTRAL ZONE.
Coming events
(Stocks potentially respond to all events).
3. A. 5/23 AM – Jupiter 90 US Venus. Major change in trend US Stocks, T-Bonds, US Dollar.
B. 5/24 AC – Geo Mars enters Aries. Important change in trend Corn, Gold, OJ, Silver, Sugar, Wheat.
C. 5/27 AC – Mercury Aphelion. Major change in trend Corn, Oats, Soybeans, Wheat.
D. 5/27 AC – Jupiter 45 US Moon. Moderate change in trend US Stocks, T-Bonds, US Dollar.
E. 5/27 AC – Jupiter Parallel Latitude Neptune. Major change in trend Commodity Index, Oats, Oil.
F. 5/27 AC – Helio Saturn Contra-Parallel Uranus. Major change in trend Cattle, Coffee, Copper, Cotton.
D. 5/27 AC – New Moon in Gemini. Major change in trend Financials, Grains, Precious Metals
Stock market key dates
5/19 = 29,241 (171^2) days > 4/28/1942 Major Low
5/28 (Sat.) = 8,100 (90^2) days > 3/24/2000 MAJOR TOP
Fibonacci – 5/28
Astro – 5/23, *5/27*
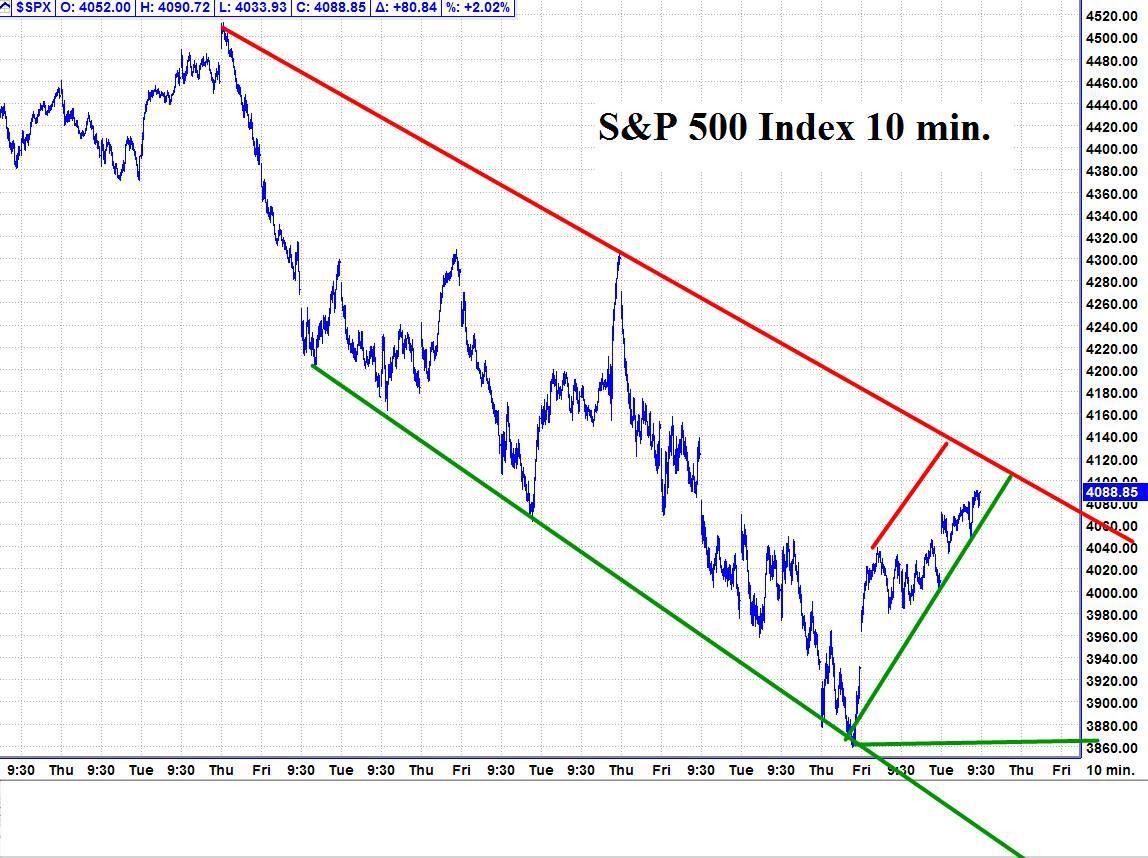
Please note that as of the 5/17 close, the S&P 500 Index was bumping up against the top of an important trend line and down channel. This means the market is likely due for a pullback or decline If the market can overcome the top of this channel, then there is a good chance for much higher prices.
Please see below the S&P 500 10 minute chart.
Support - 4060 Resistance – 4100
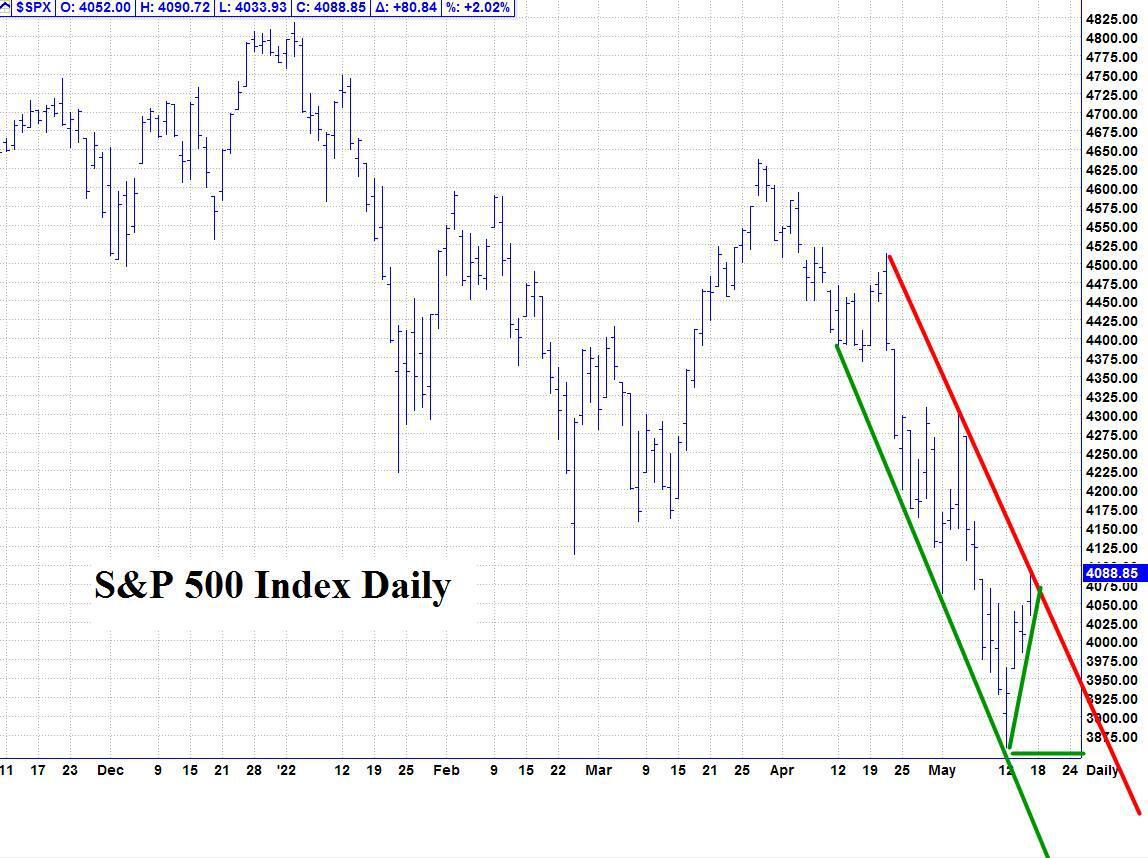
Please see below the S&P 500 Daily chart
Support - 4060 Resistance – 4100
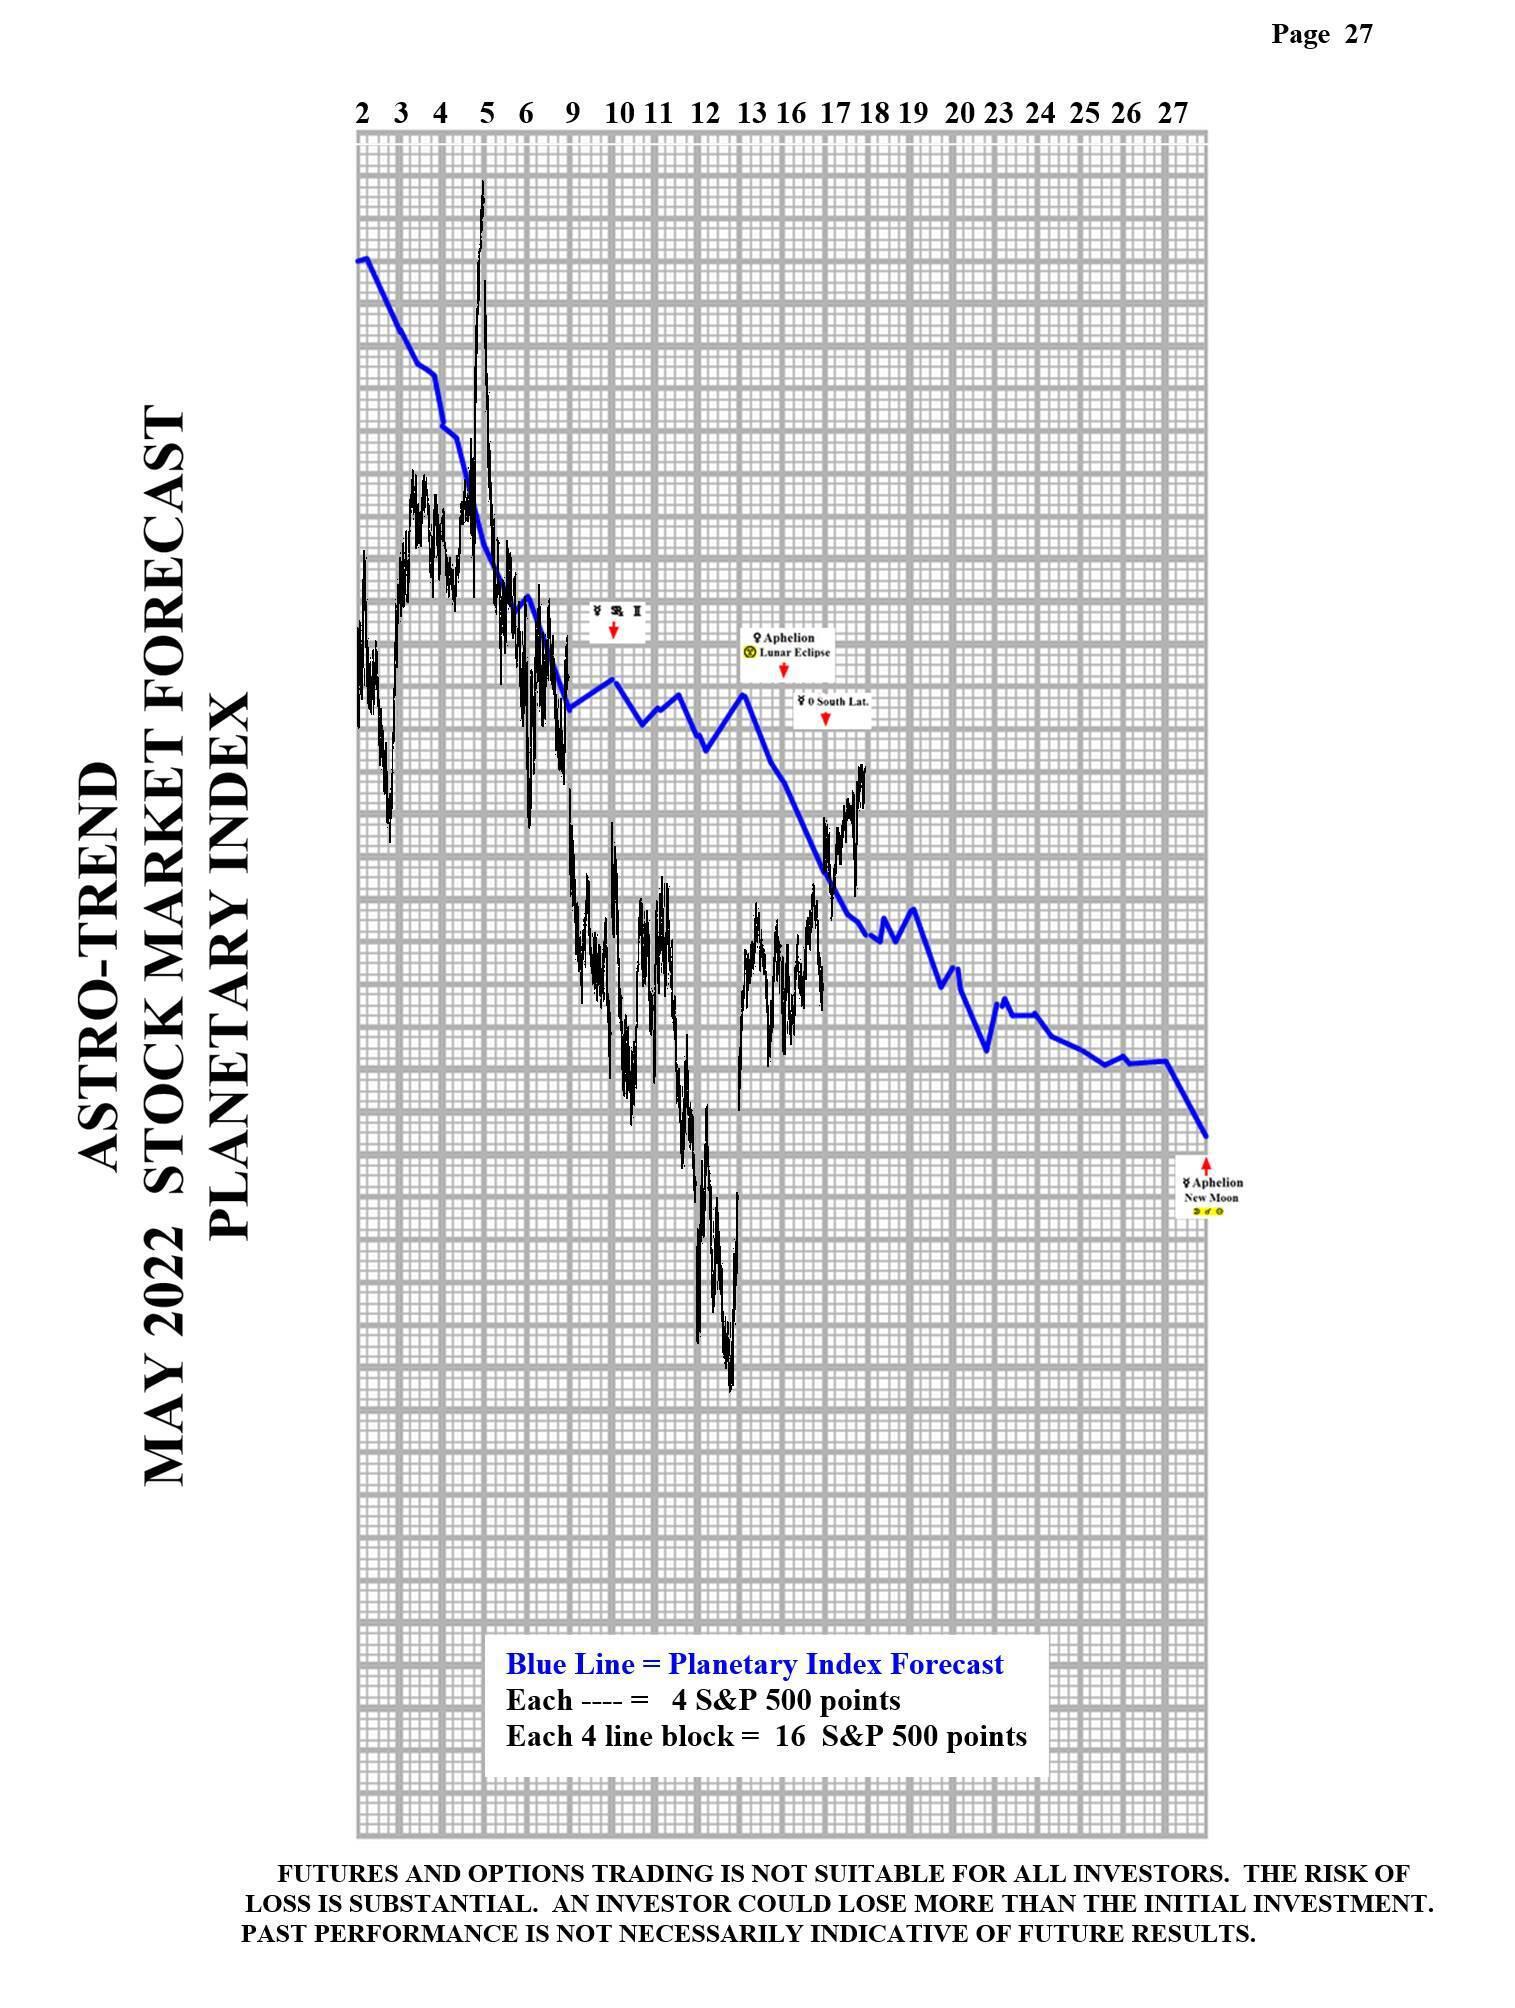
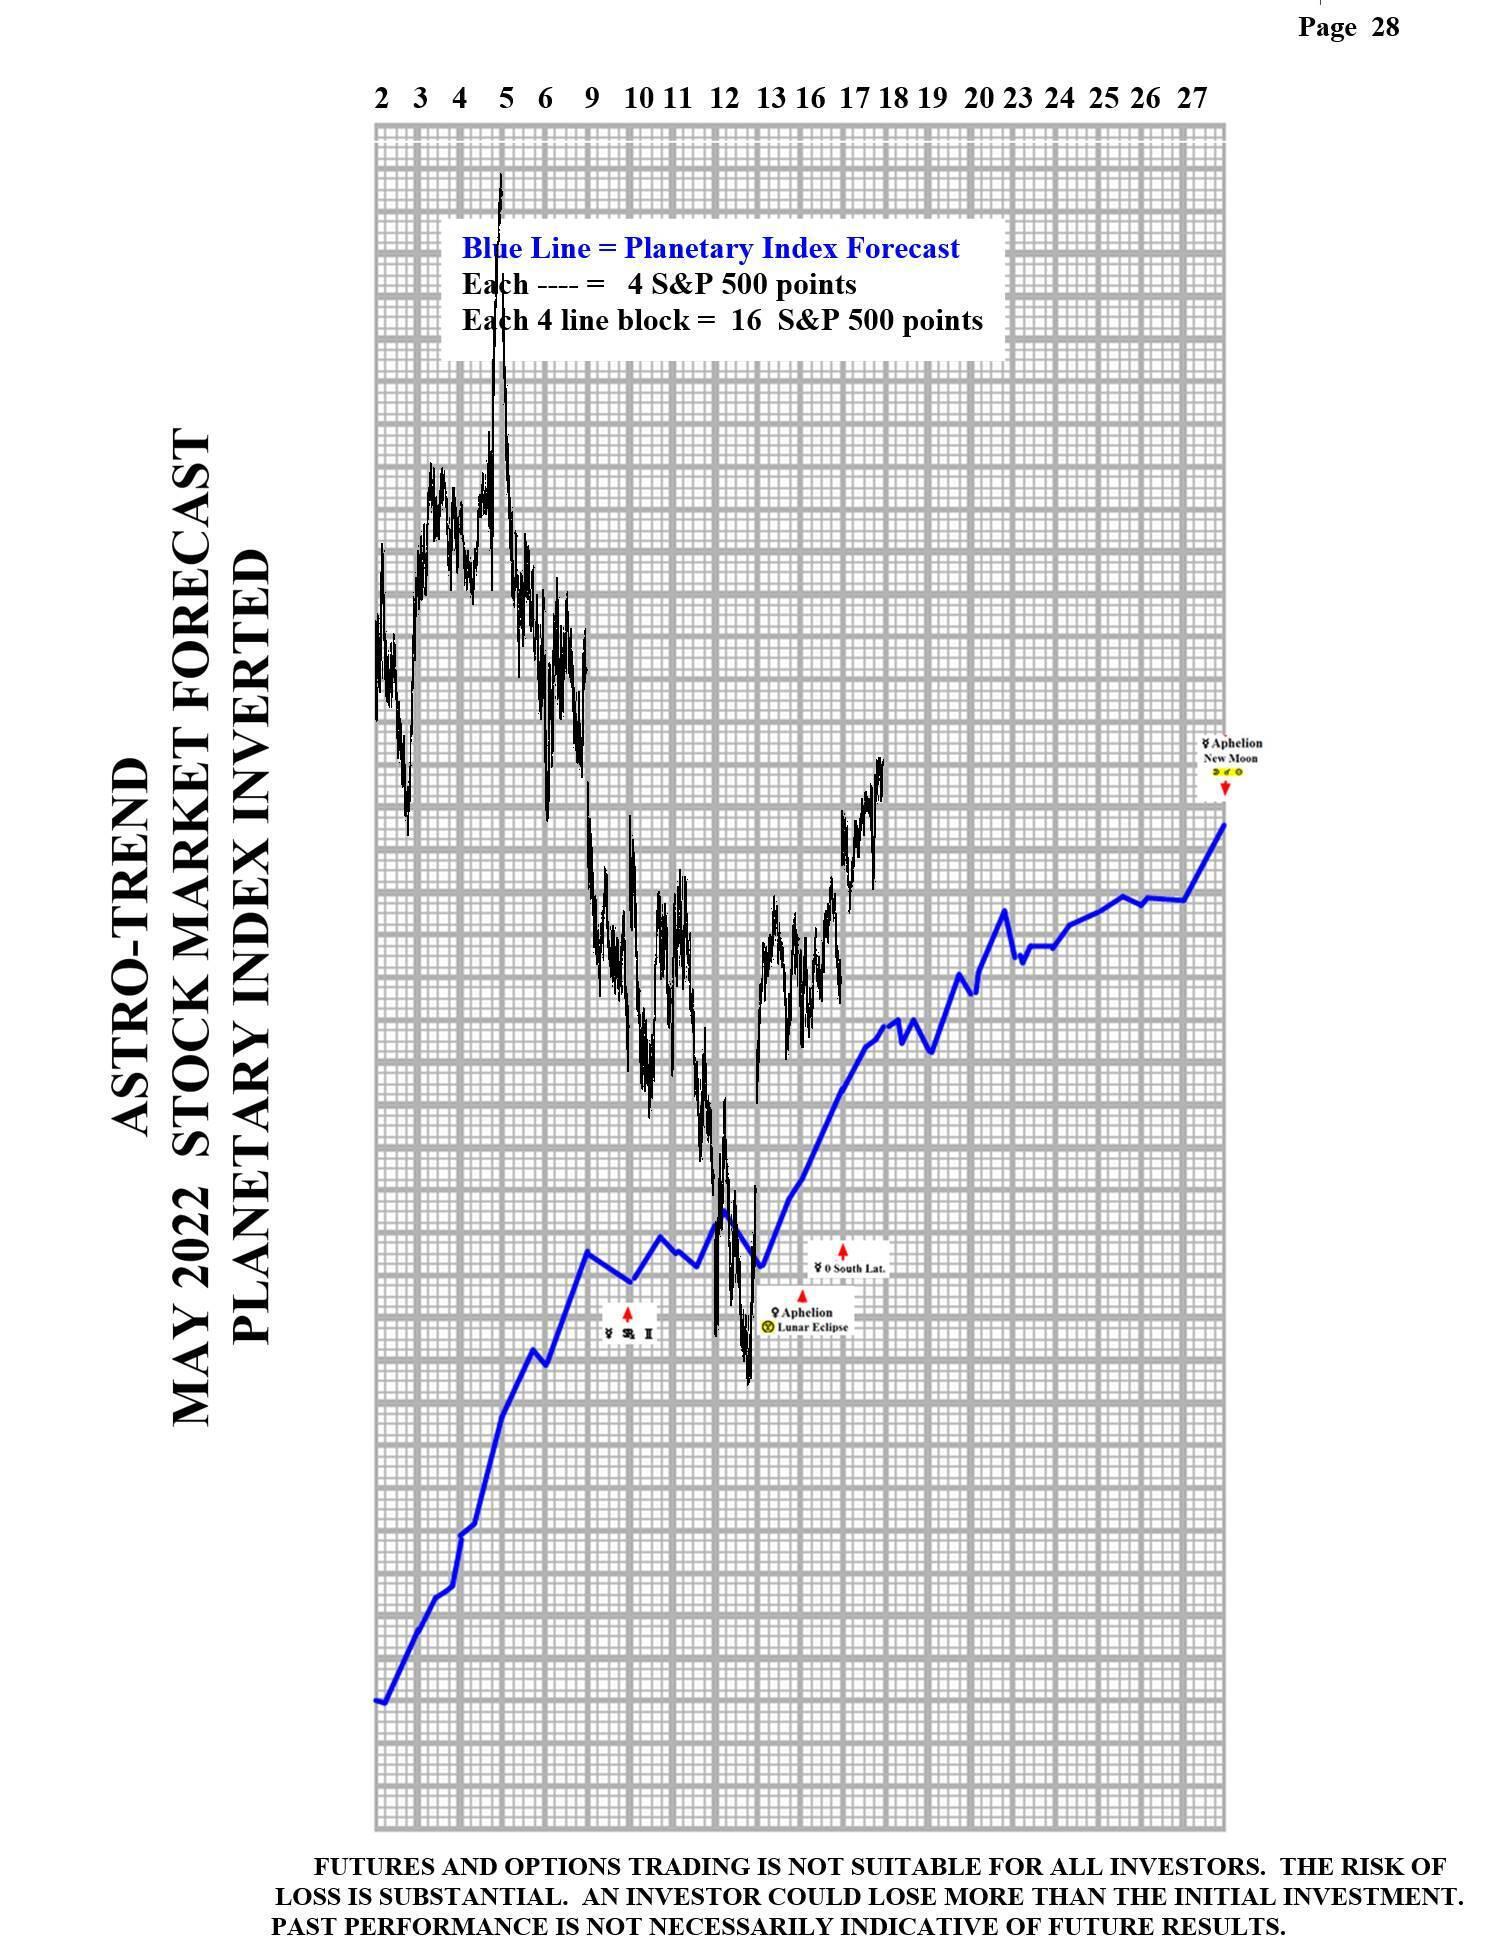
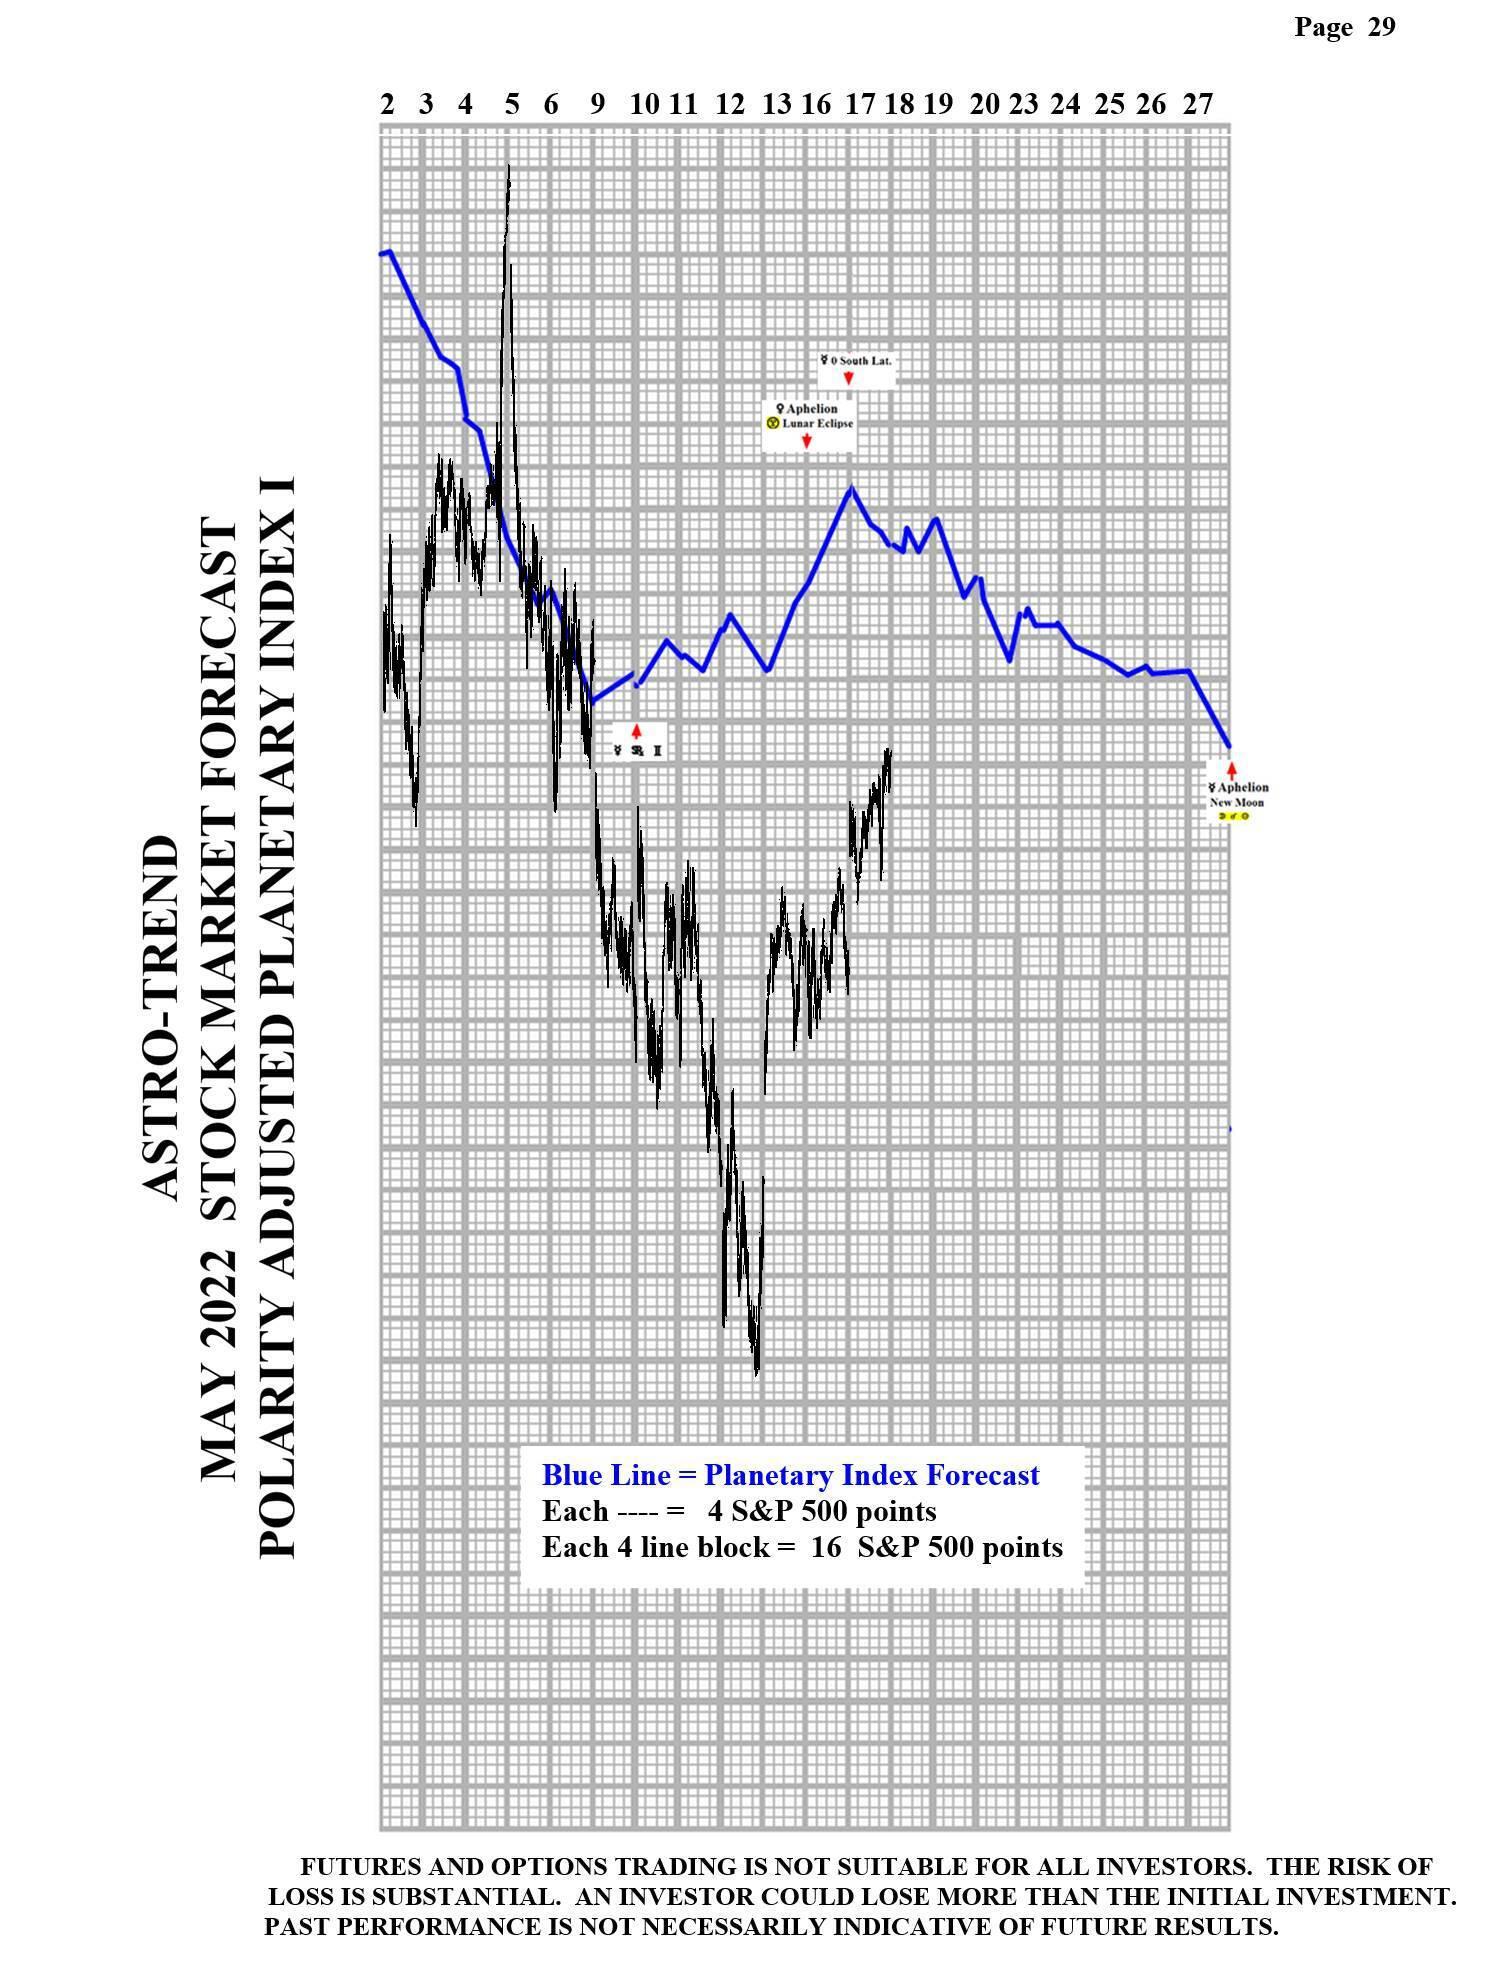
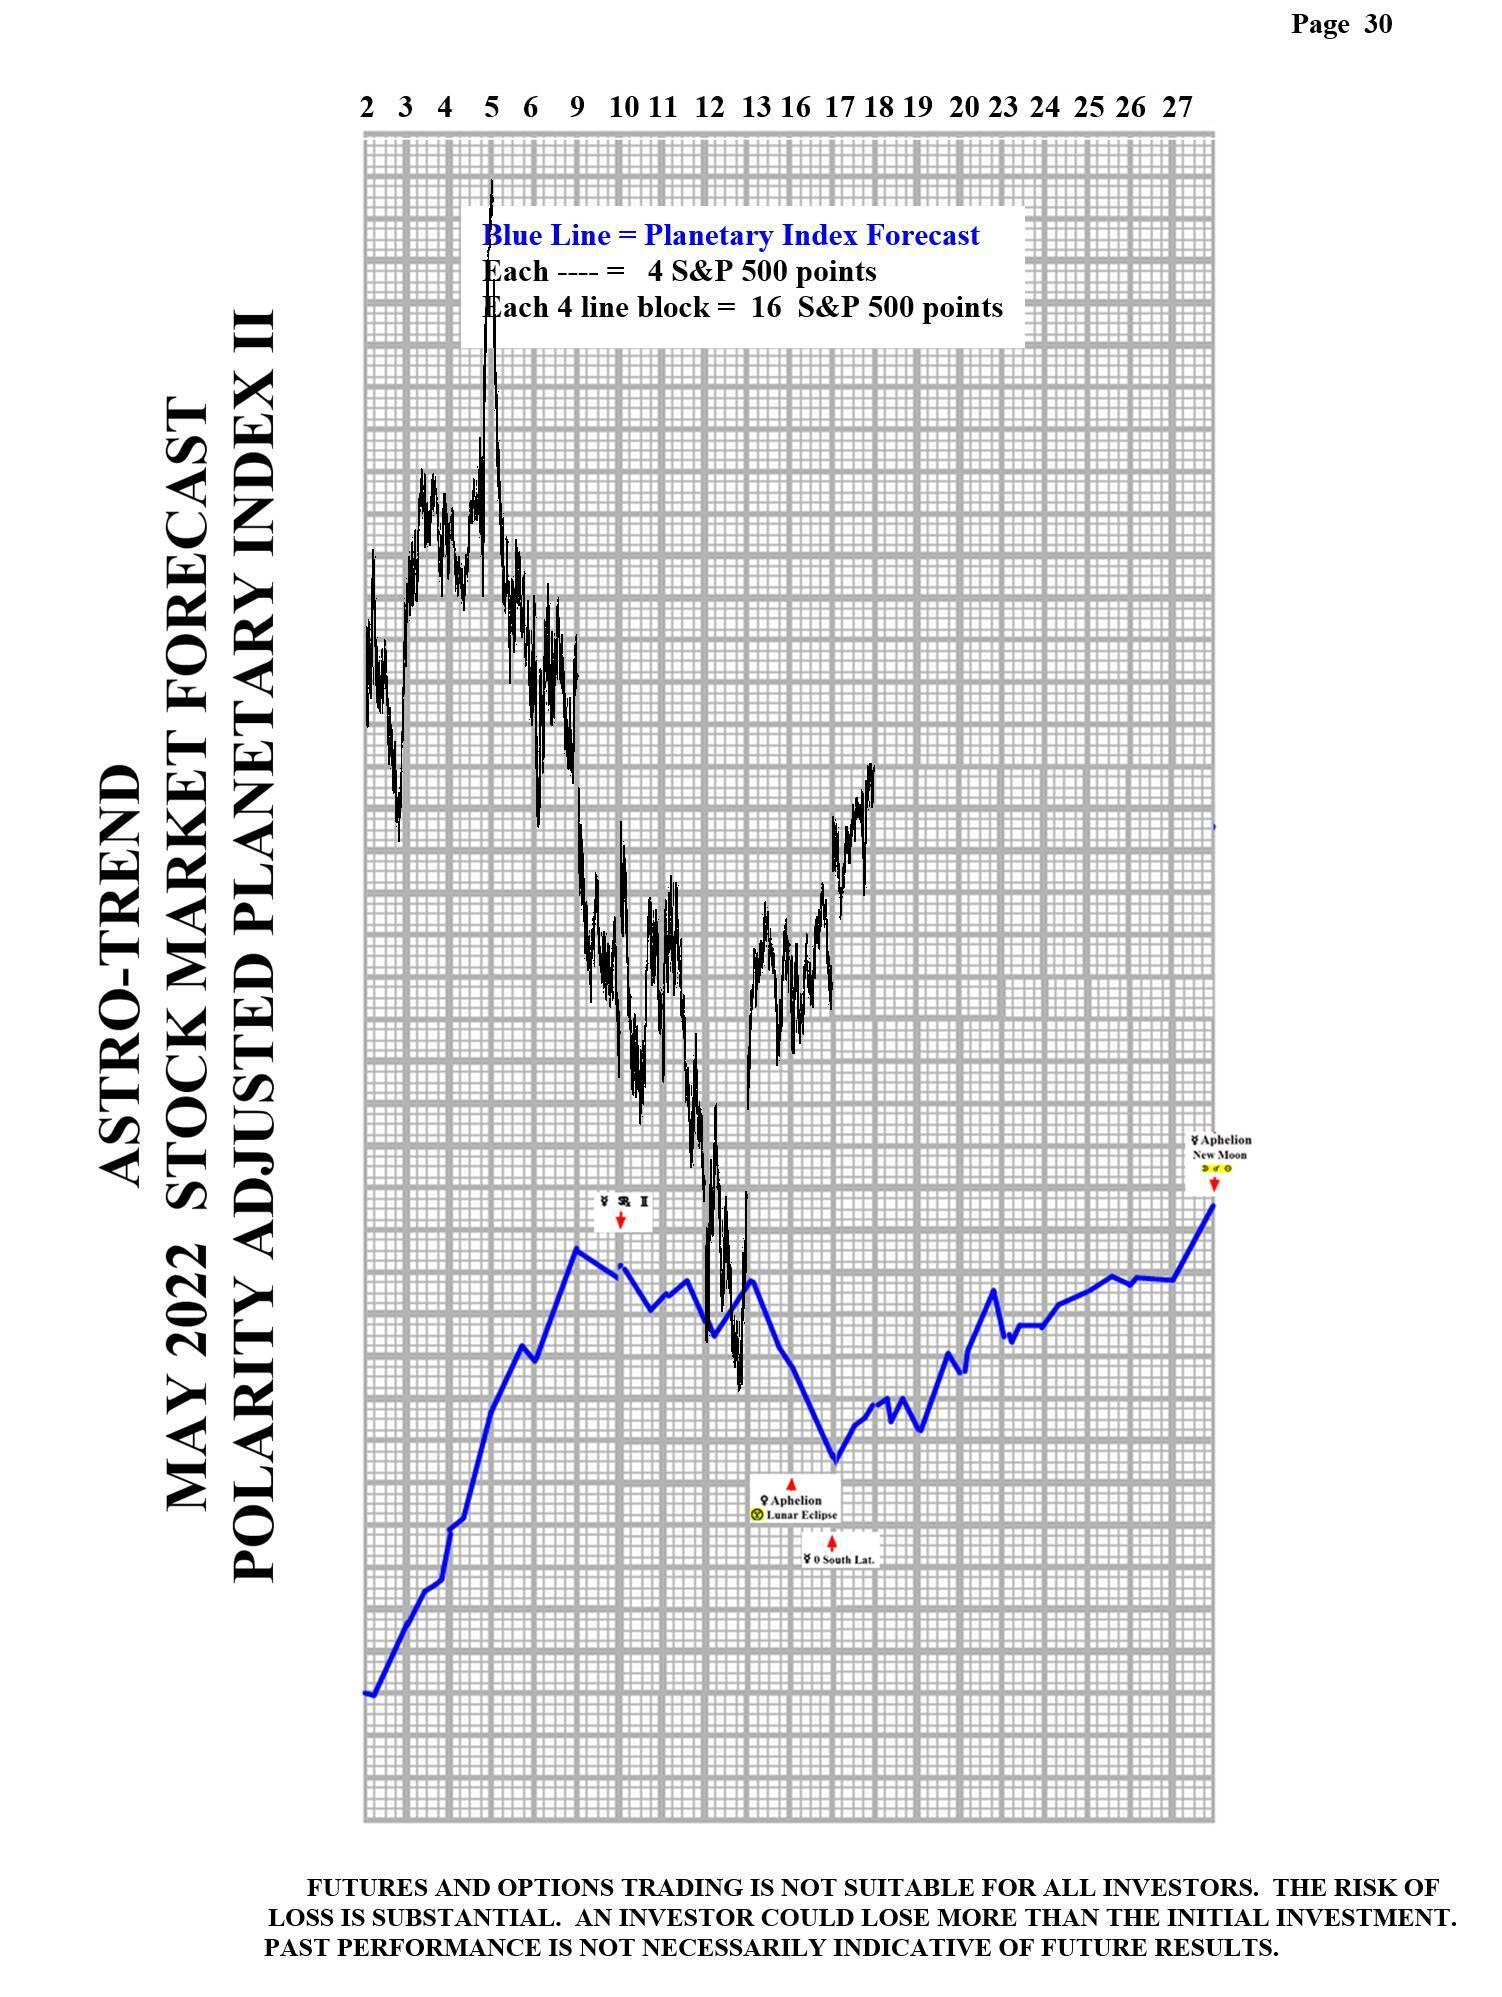
Please see below the April Planetary Index chart with S&P 500 10 minute bars for results.
Reprinted from FXStreet,the copyright all reserved by the original author.
Disclaimer: The content above represents only the views of the author or guest. It does not represent any views or positions of FOLLOWME and does not mean that FOLLOWME agrees with its statement or description, nor does it constitute any investment advice. For all actions taken by visitors based on information provided by the FOLLOWME community, the community does not assume any form of liability unless otherwise expressly promised in writing.
FOLLOWME Trading Community Website: https://www.followme.com


Hot
No comment on record. Start new comment.