USD/CNH Price Analysis: Retreats from weekly hurdle on firmer China CPI

- USD/CNH extends pullback from 19-month high on strong China inflation data.
- China CPI rose 2.1%, PPI grew 8.0%, both figures crossed market consensus.
- Sluggish RSI, a convergence of 100-HMA and short-term rising trend line challenge bears.
USD/CNH justifies strong-than-expected China inflation data by reversing from the intraday high during Wednesday’s Asian session. That said, the quote takes offers to renew daily low around 6.7400 by the press time.
China’s Consumer Price Index (CPI) rose past 1.8% market consensus to 2.1% YoY whereas the Producer Price Index (PPI) crossed 7.7% expectations with the 8.0% yearly figures.
It’s worth noting that the offshore Chinese currency (CNH) pair rallied to the highest since October 2020 before retreating from 6.7765 during the early week.
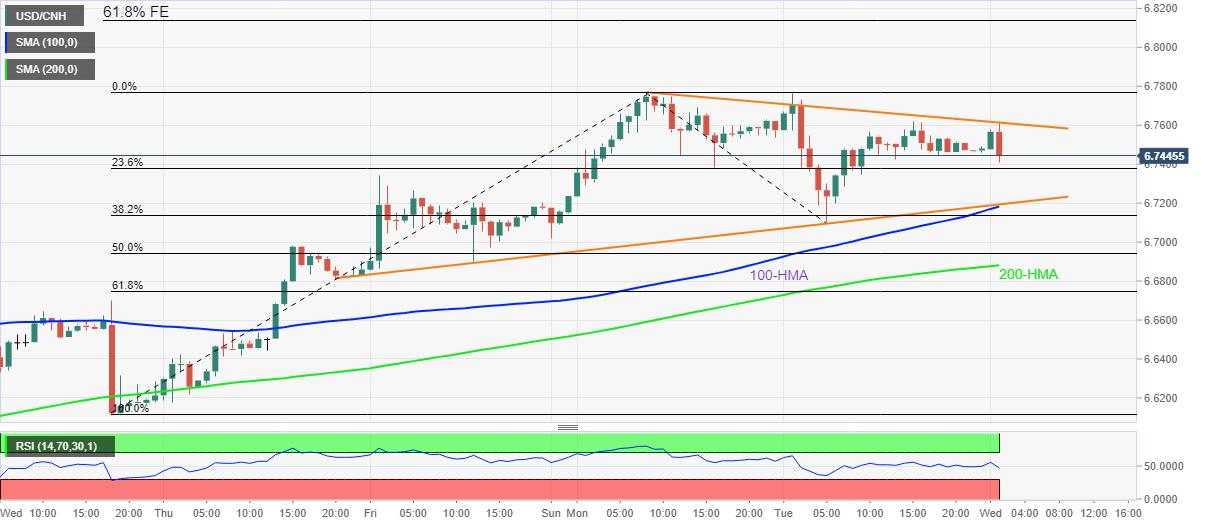
Considering the upbeat inflation numbers and the pair’s failures to refresh the multi-day high, the USD/CNH prices are likely to decline towards the immediate support, namely May 06 peak surrounding 6.7345.
However, the 100-HMA and ascending support line from May 05 portrays 6.7180 as a tough nut to crack for the pair sellers. Also acting as important support is the 200-HMA level, near 6.6880 by the press time.
Alternatively, recovery moves need to cross the immediate resistance line, at 6.7615, before challenging the multi-day high flashed on Monday around 6.7765.
In a case where USD/CNH bulls keep reins past 6.7765, the 61.8% Fibonacci Expansion (FE) of May 04-10 moves, near 6.8120, will be on their radars.
USD/CNH: Hourly chart
Trend: Pullback expected
Reprinted from FXStreet,the copyright all reserved by the original author.
Disclaimer: The content above represents only the views of the author or guest. It does not represent any views or positions of FOLLOWME and does not mean that FOLLOWME agrees with its statement or description, nor does it constitute any investment advice. For all actions taken by visitors based on information provided by the FOLLOWME community, the community does not assume any form of liability unless otherwise expressly promised in writing.
FOLLOWME Trading Community Website: https://www.followme.com


Hot
No comment on record. Start new comment.