NZD/USD Price Analysis: Extends pullback from 100-SMA towards 0.6600

- NZD/USD drops to one-week low during three-day downtrend.
- Clear break of two-week-old support line, U-turn from key SMAs keep sellers hopeful.
- 200-SMA, February’s top adds to the upside filters.
NZD/USD extends the previous two-day downtrend towards 0.6600 during Monday’s Asian session.
That said, the Kiwi pair takes offers to refresh one-week low around 0.6625, down 0.25% intraday, by the press time.
The quote broke an ascending trend line from January 28 the previous day while extending the February 10 pullback from 200-SMA.
The corrective pullback portrayed during the early Asian session failed to cross the 100-SMA level, needless to mention the support-turned-resistance and 200-SMA, which in turn joins bearish MACD signals to keep NZD/USD sellers hopeful.
During the pair’s further weakness the 0.6600 threshold may act as short-term support before the monthly low of 0.6589.
In a case where NZD/USD bears keep reins past 0.6589, January’s bottom surrounding 0.6530 will be in focus.
Alternatively, the 100-SMA and previous support line, respectively around 0.6645 and 0.6660, will restrict the short-term recovery moves of the pair.
Following that, the 200-SMA and the monthly high, near 0.6720 and 0.6735 in that order, will be crucial to watch for NZD/USD bulls.
NZD/USD: Four-hour chart
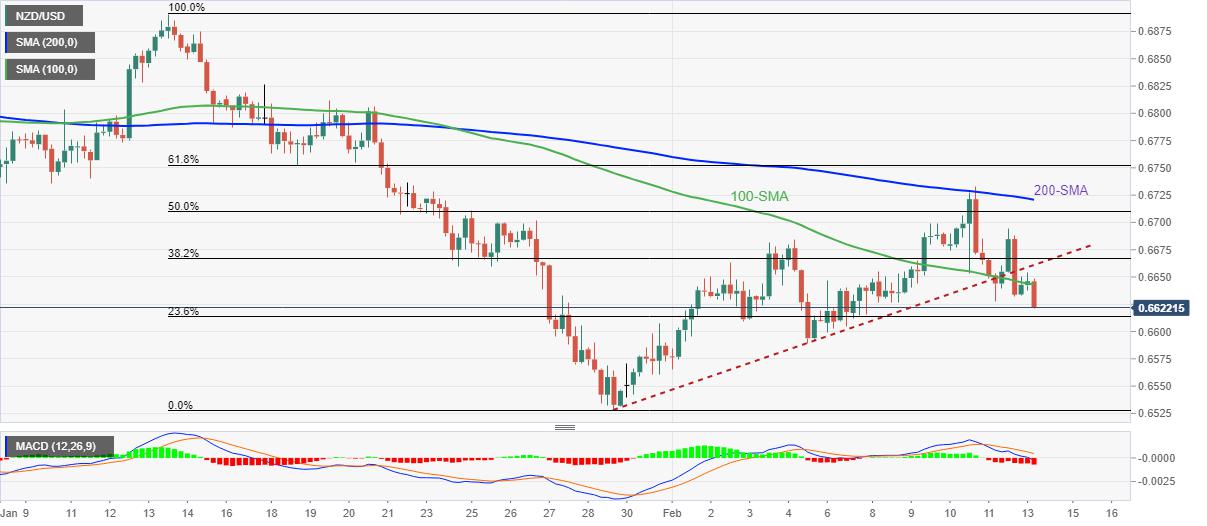
Trend: Further weakness expected
Reprinted from FXStreet_id,the copyright all reserved by the original author.
Disclaimer: The content above represents only the views of the author or guest. It does not represent any views or positions of FOLLOWME and does not mean that FOLLOWME agrees with its statement or description, nor does it constitute any investment advice. For all actions taken by visitors based on information provided by the FOLLOWME community, the community does not assume any form of liability unless otherwise expressly promised in writing.
FOLLOWME Trading Community Website: https://www.followme.com


Hot
No comment on record. Start new comment.