US Dollar Index Price Analysis: Further weakness on the cards

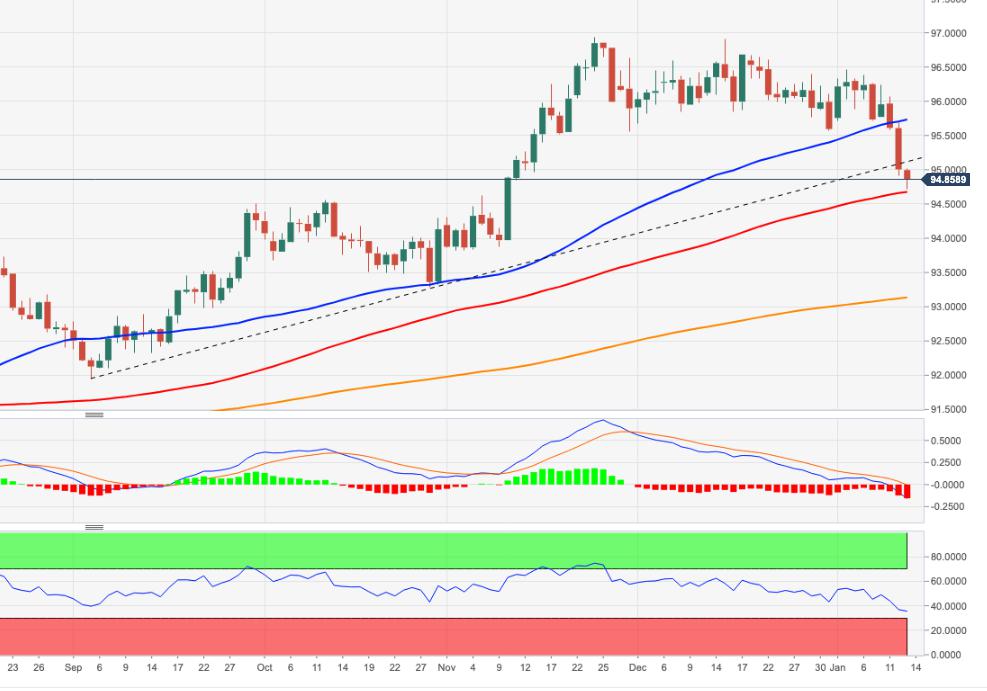
- DXY breaks below the 95.00 support with conviction.
- Immediately to the downside comes the 100-day SMA at 94.64.
DXY extends the downside further and opens the door to a deeper retracement in the very near term.
Indeed, the index broke below the 4m support line near 95.10 and the 200-week SMA at 95.07 and in doing so the upside pressure now looks mitigated, allowing for extra losses to, initially, the 100-day SMA at 94.64. If this level is breached, then there are no relevant support levels until October’s low at 93.27 (October 28 2021).
Looking at the broader picture, the longer-term positive stance remains unchanged above the 200-day SMA at 93.11.
DXY daily chart
Reprinted from FXStreet_id,the copyright all reserved by the original author.
Disclaimer: The content above represents only the views of the author or guest. It does not represent any views or positions of FOLLOWME and does not mean that FOLLOWME agrees with its statement or description, nor does it constitute any investment advice. For all actions taken by visitors based on information provided by the FOLLOWME community, the community does not assume any form of liability unless otherwise expressly promised in writing.
FOLLOWME Trading Community Website: https://www.followme.com


Hot
No comment on record. Start new comment.