Gold Price Forecast: $1,800 holds the key for XAU/USD amid rallying yields – Confluence Detector

- Gold price remains at the mercy of the Treasury yields’ price action.
- Markets are now pricing in four Fed rate hikes this year; Powell, US inflation eyed.
- Gold 2022 Outlook: Correlation with US T-bond yields to drive yellow metal.
Gold is struggling to find a clear directional bias so far this Monday, having staged an impressive bounce from three-week lows. The US Treasury yields resume the rally triggered by the Fed rate hike frenzy, lifting the dollar alongside at gold’s expense. Amid a lack of top-tier economic releases on Monday, gold price will remain at the mercy of the price action in the yields. The focus remains on Fed Chair Jerome Powell’s testimony and US inflation due later this week for a decisive move in gold price.
Read: Gold Price Forecast: Risks appear skewed to the downside, eyes on Powell, US inflation
Gold Price: Key levels to watch
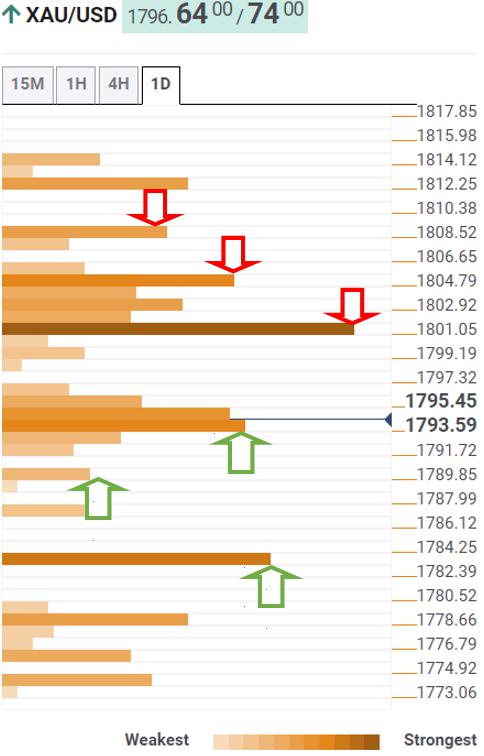
The Technical Confluences Detector shows that the gold price is pressuring a strong support at $1,793 once again, which is the convergence of the SMA100 one-day and Fibonacci 38.2% one-day.
The Fibonacci 61.8% one-day at $1,789 will guard the downside, below which sellers will gear up to test the previous day’s low at $1,783.
On the flip side, if the bulls find acceptance above the $1,800 mark, then the resumption of the previous recovery cannot be ruled out.
That level is the confluence of the SMA200 one-day, Fibonacci 38.2% one-month and one-week.
Further up, the intersection of SMA100 four-hour and SMA50 one-day at $1,805 will be a tough nut to crack for gold bulls.
The next relevant upside target is pegged at $1,809, where the pivot point one-day R2 meets with the SMA10 one-day.
Here is how it looks on the tool
About Technical Confluences Detector
The TCD (Technical Confluences Detector) is a tool to locate and point out those price levels where there is a congestion of indicators, moving averages, Fibonacci levels, Pivot Points, etc. If you are a short-term trader, you will find entry points for counter-trend strategies and hunt a few points at a time. If you are a medium-to-long-term trader, this tool will allow you to know in advance the price levels where a medium-to-long-term trend may stop and rest, where to unwind positions, or where to increase your position size.
Reprinted from FXStreet_id,the copyright all reserved by the original author.
Disclaimer: The content above represents only the views of the author or guest. It does not represent any views or positions of FOLLOWME and does not mean that FOLLOWME agrees with its statement or description, nor does it constitute any investment advice. For all actions taken by visitors based on information provided by the FOLLOWME community, the community does not assume any form of liability unless otherwise expressly promised in writing.
FOLLOWME Trading Community Website: https://www.followme.com


Hot
No comment on record. Start new comment.