USD/CAD Price Analysis: Tumbles to test 100-DMA after previous week’s falling wedge fakeout

- USD/CAD keeps corrective decline intact from six-day highs of 1.2813.
- The oil price recovery and the US dollar’s weakness weighed heavily on the spot.
- The pair’s falling wedge breakout on the daily sticks appears to be a fakeout.
Having faced rejection once again near 1.2810 in the previous week. USD/CAD changed its course and kicked off a remarkable pullback.
The downturn in the currency pair was helped by the rebound in WTI prices and the renewed US dollar’s weakness, as investors assessed the mixed American labor market report released on Friday.
The headline US NFP disappointed with 199K in December, although the hourly wages were a big surprise. The tech sell-off on Wall Street is what really caused trouble for the greenback, despite the Fed rate hike outlook for this year.
Meanwhile, stronger Canadian employment data also boded well for the CAD, collaborating with the downside in the major. The focus this week remains on the US inflation report and retail sales data amid a relatively light week.
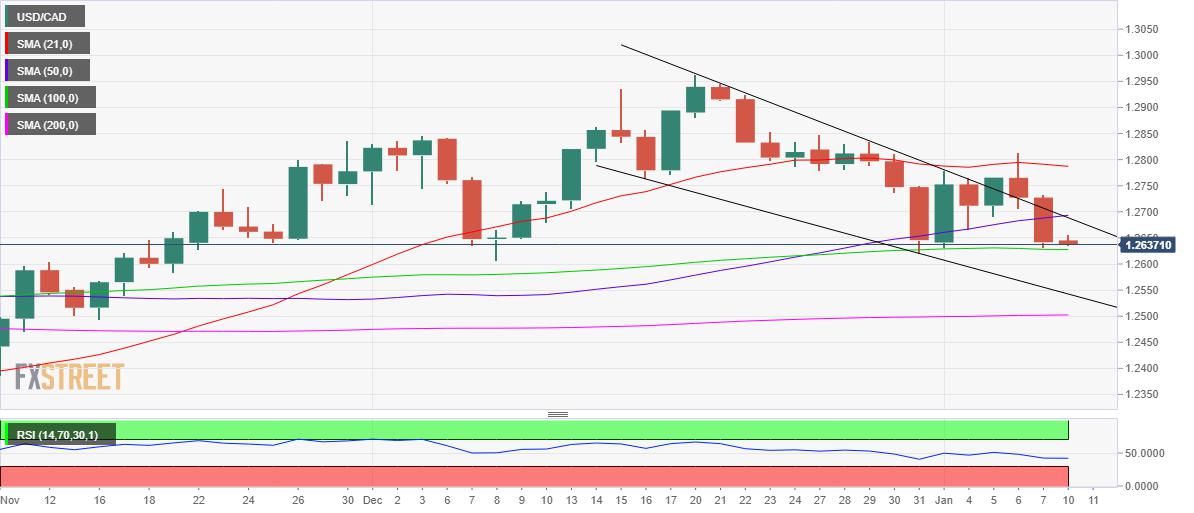
Technically, USD/CAD confirmed a falling wedge breakout on Wednesday after closing the day above the falling trendline resistance at 1.2743. Although that appears to be a fakeout after the pair turned south on failure to find acceptance above the critical 21-Daily Moving Average (DMA) at 1.2787.
That said, the price is now testing the horizontal 100-DMA at 1.2627, having breached the 50-DMA support at 1.2693, where the wedge resistance-turned-support aligns.
A sustained break below the 100-DMA will open the additional downside towards the wedge support at 1.2542. Ahead of that the 1.2600 level could be probed.
The 14-day Relative Strength Index (RSI) is holding well below the midline, backing the bearish potential.
USD/CAD: Daily chart
Recapturing the abovementioned powerful resistance near 1.2690 is critical to initiating any meaningful recovery.
Further up, bulls could once again challenge Friday’s high of 1.2732.
USD/CAD: Additional levels to consider
Reprinted from FXStreet_id,the copyright all reserved by the original author.
Disclaimer: The content above represents only the views of the author or guest. It does not represent any views or positions of FOLLOWME and does not mean that FOLLOWME agrees with its statement or description, nor does it constitute any investment advice. For all actions taken by visitors based on information provided by the FOLLOWME community, the community does not assume any form of liability unless otherwise expressly promised in writing.
FOLLOWME Trading Community Website: https://www.followme.com


Hot
No comment on record. Start new comment.