AUD/USD Price Analysis: Drops to fortnight low under 0.7200 on rising wedge confirmation

- AUD/USD drops to the lowest in two weeks on confirming a bearish chart pattern.
- RSI retreat, receding bullish bias of MACD also favor sellers.
- Key SMAs restrict immediate upside, 2021 bottom lures bears.
AUD/USD takes offers around 0.7170, down 0.70% intraday to flash a two-week low during early Thursday morning in Europe.
Following a clear downside break of 21-DMA, AUD/USD prices broke the support line of a monthly rising wedge bearish chart formation, which in turn underpin the latest losses of the quote. Also adding to the bearish bias are the downbeat RSI and MACD conditions.
That said, the late December’s swing low around 0.7080 may offer an intermediate halt during the quote’s theoretical target surrounding the 0.7000 threshold, comprising 2021 low.
In a case where the AUD/USD prices remain bearish past 0.7000, June 2020 low near 0.6775 will be in focus.
Alternatively, the support-turned-resistance line of the wedge and 21-DMA, respectively around 0.7185 and 0.7195, will restrict the quote’s corrective pullback.
It’s worth noting that a clear upside break of 0.7195 will propel the quote towards 50% Fibonacci retracement (Fibo.) of October-December downside, around 0.7275.
Though, the AUD/USD pair’s advances beyond 50% Fibo. will be challenged by the 100-DMA and resistance line of the stated wedge, close to 0.7290 and 0.7305 in that order.
AUD/USD; Daily chart
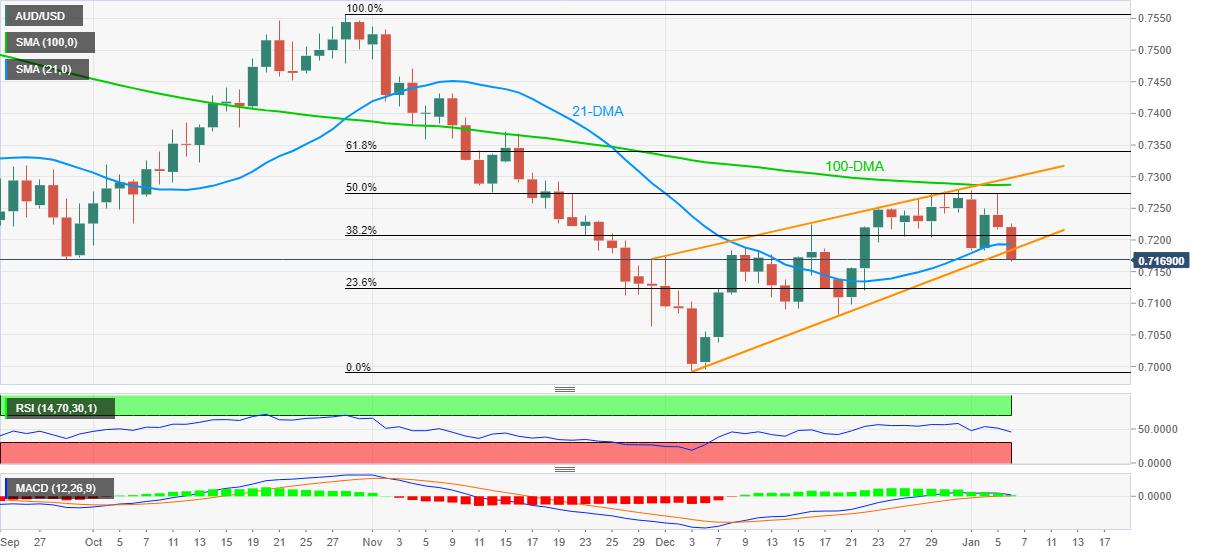
Trend: Further weakness expected
Reprinted from FXStreet_id,the copyright all reserved by the original author.
Disclaimer: The content above represents only the views of the author or guest. It does not represent any views or positions of FOLLOWME and does not mean that FOLLOWME agrees with its statement or description, nor does it constitute any investment advice. For all actions taken by visitors based on information provided by the FOLLOWME community, the community does not assume any form of liability unless otherwise expressly promised in writing.
FOLLOWME Trading Community Website: https://www.followme.com


Hot
No comment on record. Start new comment.