US Dollar Index Price Analysis: Bulls step back from 200-HMA above 96.00

- DXY prints four-day uptrend, eases from intraday high.
- Firmer RSI favors bulls, weekly resistance line adds to the upside filters.
- Sellers await break of the immediate rising trend line.
US Dollar Index (DXY) pares intraday gains, the fourth in a row, around 96.25 during early Monday. In doing so, the greenback gauge battles 200-HMA to extend the previous week’s rebound.
Considering the firmer RSI line, not overbought, coupled with the sustained move beyond a one-week-old ascending support line, the US Dollar Index is likely to overcome the immediate hurdle around 96.30.
However, a descending trend line from November 24, near 96.40, challenges the DXY bulls.
Should the quote rises past 96.40, the November-end high around 96.65 will precede the previous month’s peak, also the highest level since mid-2020, close to the 97.00 threshold to challenge the greenback bulls.
Meanwhile, pullback moves remain elusive until staying beyond the nearby support line, around 96.00 at the latest.
In a case where the DXY bears remain dominant past 96.00, the latest swing low near 95.55 and the September 2020 peak of 94.75 will be in focus.
DXY: Hourly chart
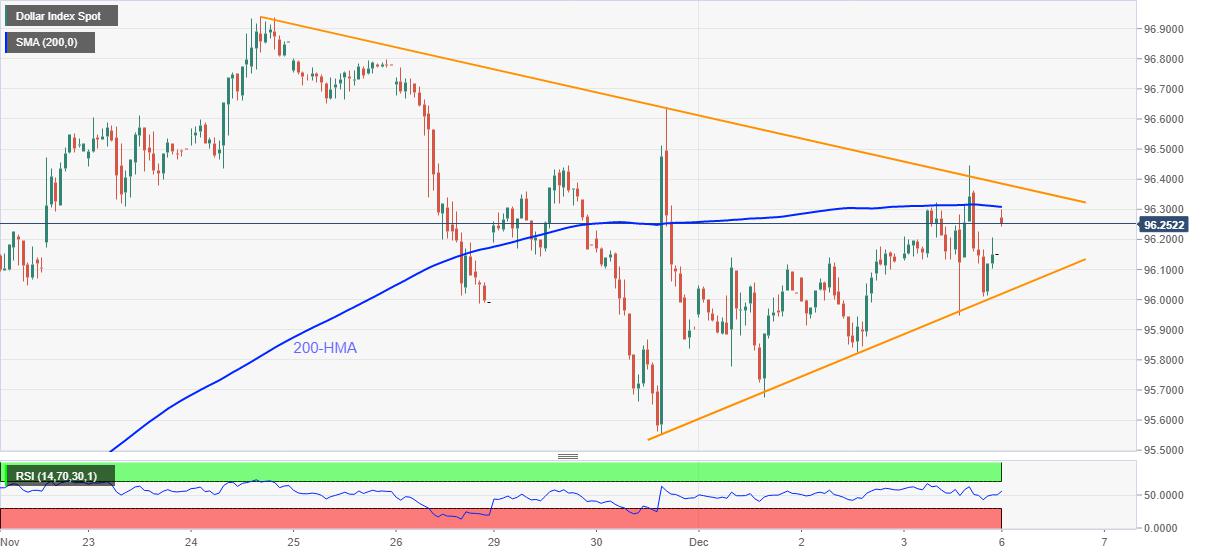
Trend: Bullish
Reprinted from FXStreet_id,the copyright all reserved by the original author.
Disclaimer: The content above represents only the views of the author or guest. It does not represent any views or positions of FOLLOWME and does not mean that FOLLOWME agrees with its statement or description, nor does it constitute any investment advice. For all actions taken by visitors based on information provided by the FOLLOWME community, the community does not assume any form of liability unless otherwise expressly promised in writing.
FOLLOWME Trading Community Website: https://www.followme.com


Hot
No comment on record. Start new comment.