AUD/USD Price Analysis: Bounces towards 0.7250 despite firmer US dollar

- AUD/USD licks its wound after hitting six-week lows on Friday.
- Renewed covid woes-led risk-aversion boosts the US dollar at the aussie’s expense.
- The aussie tests key support on the daily chart, remains vulnerable.
AUD/USD is consolidating Friday’s steep losses below 0.7250, licking its wounds amid broad risk-aversion.
The markets remain in a risk-off mode, thanks to the covid resurgence in Europe and worries over the potential curbs to contain the virus. The flight to safety underpins the safe-haven demand for the US dollar while weighing on the higher-yielding aussie.
Further, the rise in the US Treasury yields amid Fed’s hawkish expectations heading into this week FOMC minutes also adds to the strength in the greenback against its major rivals.
In the day ahead, the covid updates worldwide combined with the US Existing Home Sales data will be eyed for fresh trading impetus.
Looking at AUD/USD’s daily chart, the pair is trying hard to defend the critical daily support line at 0.7225, where the October 6 low lies.
The next critical support is seen at the 0.7200 psychological level.
A sustained break below the latter will fuel a fresh decline towards the end-September lows of 0.7169.
AUD/USD: Daily chart
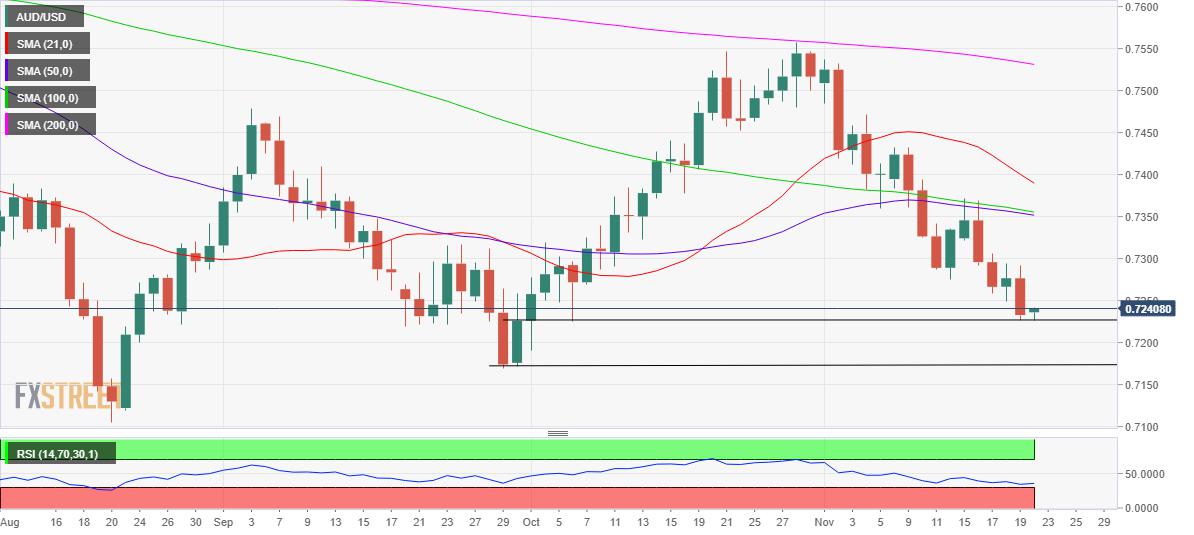
The 14-Day Relative Strength Index (RSI) is recovering from lower levels, currently flatlined around 35.26, suggesting that a minor correction could be in the offing.
For the rebound to pick up pace, the AUD bulls need to recapture 0.7250, above which Friday’s high of 0.7292 could get retested.
The next line of defense for the sellers is seen at 0.7351, where the 100 and 50-Daily Moving Averages (DMA) converge.
AUD/USD: Additional levels to consider
Reprinted from FXStreet_id,the copyright all reserved by the original author.
Disclaimer: The content above represents only the views of the author or guest. It does not represent any views or positions of FOLLOWME and does not mean that FOLLOWME agrees with its statement or description, nor does it constitute any investment advice. For all actions taken by visitors based on information provided by the FOLLOWME community, the community does not assume any form of liability unless otherwise expressly promised in writing.
FOLLOWME Trading Community Website: https://www.followme.com


Hot
No comment on record. Start new comment.