Gold Price Forecast: XAU/EUR bull’s attack €1,650 for the second time in the year

- XAU/EUR bulls attack the €1,650 area for the second day in a row.
- XAU/EUR found strong support around the €1,630 area.
- German 10-year real yields keep falling below -2.0%, boosting gold prospects versus the euro.
Gold (XAU/EUR) against the EUR advances during the New York session, up 0.78%, trading at €1,648 at the time of writing. On Tuesday, the eight-day rally was capped as XAU/EUR printed its first close in the red, at €1,636, a tad above the top-trendline of Andrew Pitchfork’s indicator.
In the overnight session, XAU/EUR dropped to the 50-hour simple moving average (HSMA) at €1,634 but found bids around that area that pushed the pair towards a renewed test of the €1,650 year-to-date high, settling at current levels abovementioned.
German 10-year real yields keep falling below -2.0%, boosting gold prospects versus the euro
At press time, the German 10-year Bund yield is flat at the session at -.02405, while the German 10-year real yields are falling, down to -2.066, acting as a headwind for the XAU/EUR.
Earlier in the New York session, ECB’s Governing Council member Isabel Schnabel said that the rise in inflation expectations is a welcome development, per Reuters. She added that the ECB would continue buying bonds at a low level, signaling that a rate hike is not imminent. Hence, it reinforced the dovish posture by the European Central Bank (ECB).
Therefore, XAU/EUR outlook looks positive for the non-yielding metal as the German 10-year real yields keep pushing lower. In fact, that would also hurt the euro’s prospects against the US Dollar as bond spreads widen, extending its fall towards the 1.1300 figure and potentially lower.
XAU/EUR Price Forecast: Technical outlook
Daily chart
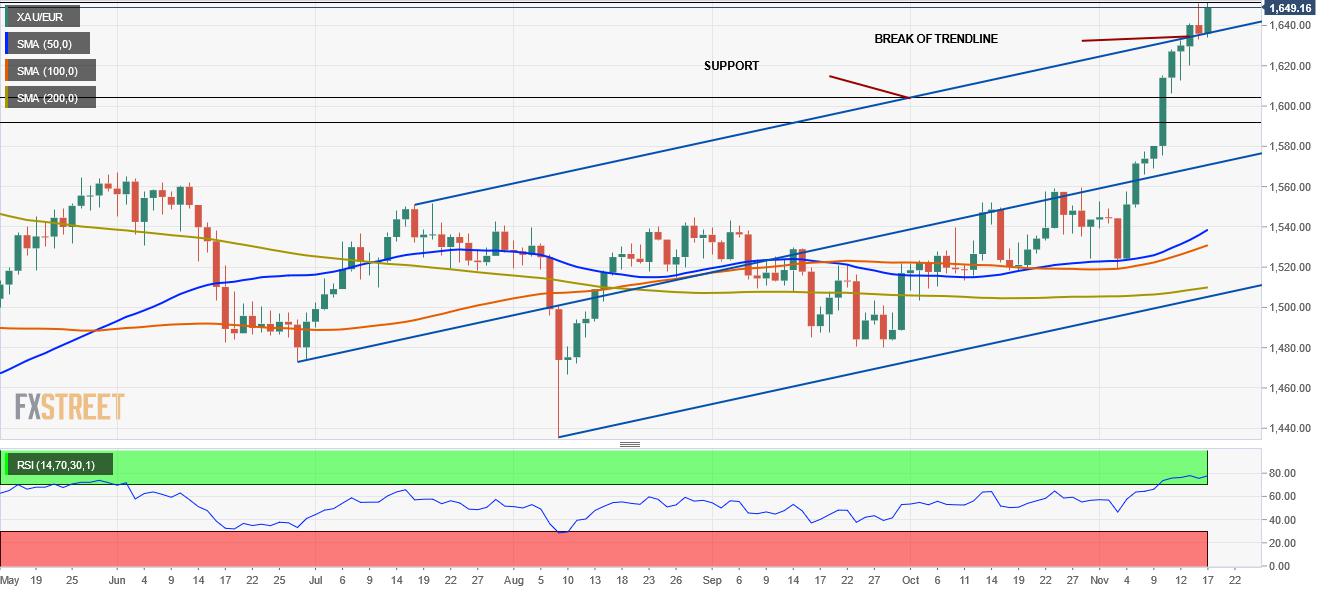
Despite that XAU/EUR had a down day on Tuesday, the uptrend keeps intact, as long as the daily moving averages (DMA’s) reside below the spot price and if gold keeps trading above the €1,567 price level. Further, Tuesday’s price action formed a spinning-top, closing below Monday’s close, but it failed to break below Andrew Pitchfork’s top-trendline indicator, finding support around the €1,630 region.
The Relative Strength Index (RSI) keeps at overbought levels at 78, though it is flattish, suggesting that gold might consolidate before trying to break above €1,650 for the first time in the year.
In that outcome, the top of Andrew Pitchfork’s channel would be the first support area, around €1,630. Also, a break below the abovementioned could open the door for a further correction, towards November 13, 2020, high at €1,604.
Reprinted from FXStreet_id,the copyright all reserved by the original author.
Disclaimer: The content above represents only the views of the author or guest. It does not represent any views or positions of FOLLOWME and does not mean that FOLLOWME agrees with its statement or description, nor does it constitute any investment advice. For all actions taken by visitors based on information provided by the FOLLOWME community, the community does not assume any form of liability unless otherwise expressly promised in writing.
FOLLOWME Trading Community Website: https://www.followme.com


Hot
No comment on record. Start new comment.