USD/CAD Price Analysis: Continues to ride the bullish wave, key Fibo. level eyed

- USD/CAD holds onto 1.2570, bullish MACD supports the price action.
- The pair appends Tuesday trade, sustained upside favors buyers.
- The loonie grinds to stay above 38.2% Fibo. level, Key Fibonacci retracement levels ahead.
The USD/CAD pair continues to ride on the higher side for the second consecutive day on Wednesday. At the time of writing, the currency pair is firmly holding its ground above the 1.2570 level with a high of 1.2586 and a low of 1.2553.
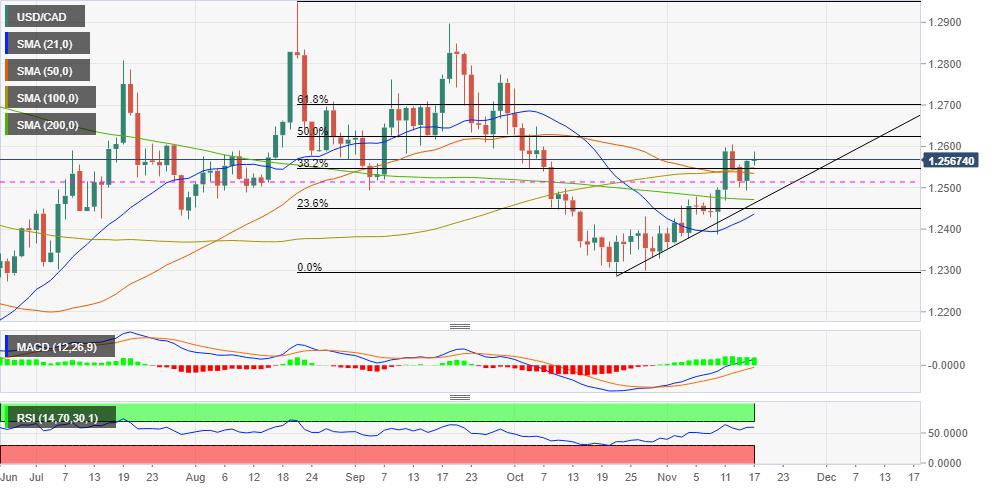
As per the daily chart, the loonie fancies a journey up, as seen from September 21 onwards. Here, the line crosses between 200-day Simple Moving Average (SMA) and 21-day SMA extending support to the loonie’s price action on November 10.
To further support the argument, Tuesday's FX action is mirroring the August 16 value, with a high 1.2570 and low 1.2550 (round figure). It is to be noted, the bull run from then onwards continued till August 19 with a high of 1.2830. This will undoubtedly keep the loonie buyer hopeful.
As per Fibonacci Retracement (Fibo.) drawn from the August 20 sell-off, the loonie remains between 38.2% Fibo. and 50.0% Fibo. Now, if the pair is able to break above 1.2605, a weekly high, it will have to further move towards 1.2739 after taking out the goodish 61.8% barrier sitting at 1.2700 level.
The USD/CAD pair's downside momentum from 38.2% Fibo. will call for a test of a confluence of 100-50-Day SMA at 1.2500 (round figure). The next support is at 200-day SMA, aligned at 1.2471. Further south, 21-day SMA, 1.2436 can be found defending the pair's descent.
The Moving Average Convergence Divergence (MACD) shows a bullish bias. The Relative Strength Index (RSI) level is holding above the 50-line horizon, backing the upward momentum.
USD/CAD daily chart
USD/CAD additional levels
Reprinted from FXStreet_id,the copyright all reserved by the original author.
Disclaimer: The content above represents only the views of the author or guest. It does not represent any views or positions of FOLLOWME and does not mean that FOLLOWME agrees with its statement or description, nor does it constitute any investment advice. For all actions taken by visitors based on information provided by the FOLLOWME community, the community does not assume any form of liability unless otherwise expressly promised in writing.
FOLLOWME Trading Community Website: https://www.followme.com


Hot
No comment on record. Start new comment.