Gold Price Forecast: XAU/USD looks back to $1,868 yearly hurdle on sluggish yields

- Gold consolidates the heaviest daily fall in two weeks following a pullback from five-month high.
- Risk appetite dwindles amid stimulus hopes, immediate relief from US debt ceiling talks and Fed rate hike concerns.
- Sino-American ties may have a long way to impress markets, Fedspeak in focus.
- Gold Price Forecast: Corrective decline could reach 1,830
Gold (XAU/USD) prints mild intraday gains around $1,855 during early Wednesday. The metal witness a volatile session on Tuesday that snatched the quote from a multi-day peak towards marking the heaviest daily loss in a fortnight.
The metal’s latest consolidation could be linked to the sluggish US Treasury yields, as well as the US Dollar Index (DXY), after a two-day uptrend. That said, the US 10-year Treasury yields pause around 1.64% after the recent run-up to renew the highest levels since October 26 whereas the DXY clings to a 16-month high around 95.90. Also favoring the gold buyers could be the firmer stock futures, following the upbeat Wall Street close.
Comments from San Francisco Federal Reserve Bank President Mary Daly contradict the previously hyped need for the Fed rate hike, by St. Louis Fed President James Bullard, as well as ex-US Treasury Secretary Lawrence Summers and former New York Fed President Bill Dudley.
In addition to the challenges to Fed hawks, easing pressure to discuss the debt ceiling extension also helps the gold buyers to remain hopeful. Recently, US Treasury Secretary Janet Yellen offered some relief to the markets by announcing a bit more time before the debt ceiling expires, from December 03 to 15, due to US President Biden’s latest stimulus.
Additionally, a lack of major data/events in Asia and no major entertainment from the talks between US President Joe Biden and his Chinese counterpart Xi Jinping also allow gold traders to recover the previous day’s losses.
It’s worth noting that, an eight-month high US Retail Sales for October, 1.7% MoM versus 1.4% expected, joined strong US Industrial Production and housing market data to enable Fed policymakers in pushing the rate hike concerns.
Hence, Wednesday’s light calendar will highlight the Fedspeak to reconfirm the policymakers’ bullish bias and challenge the gold traders.
Technical analysis
Overbought RSI conditions triggered the gold prices pullback from a multi-day peak, not to forget dragging it back from a yearly resistance line, the previous day. However, the yellow metal remains above a longer-term previous resistance line from August 2020, around $1,828 by the press time.
Given the bullish MACD signals and the absence of overbought RSI at present, as well as sustained trading beyond the key trend line, gold prices are likely to remain directed towards the descending resistance line from January 2021, near $1,868.
Should gold buyers manage to conquer the $1,868 hurdle, the quote’s run-up towards another resistance line, from September 2020 close to $1,906, can’t be ruled out.
Meanwhile, further weakness may aim for the $1,828 level comprising resistance-turned-support line whereas sustained trading below the same could recall sellers targeting October’s peak of $1,813.
Gold: Daily chart
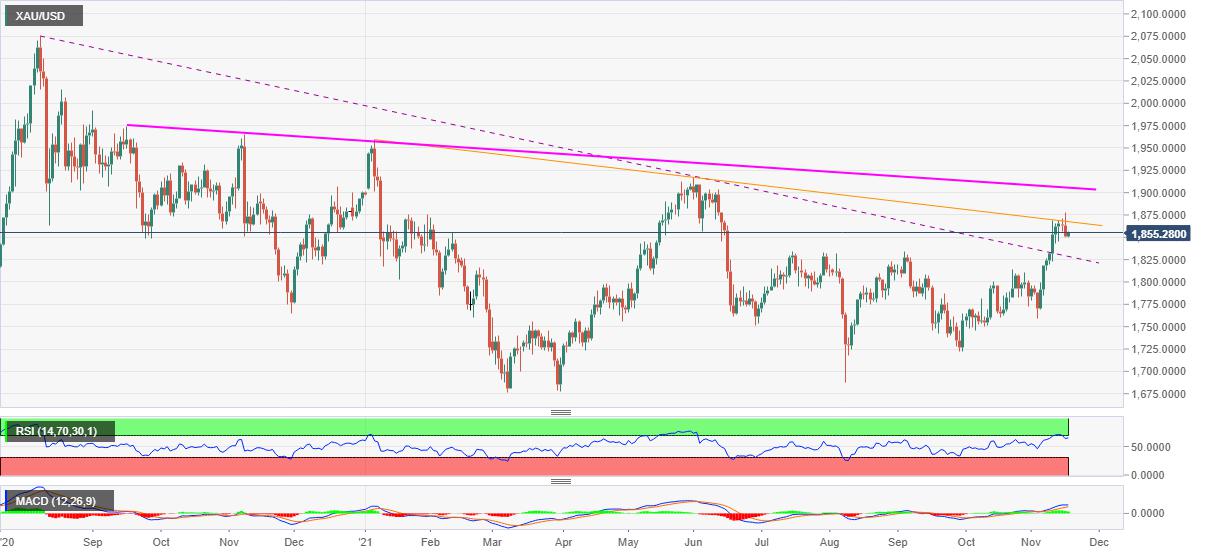
Trend: Bullish
Reprinted from FXStreet_id,the copyright all reserved by the original author.
Disclaimer: The content above represents only the views of the author or guest. It does not represent any views or positions of FOLLOWME and does not mean that FOLLOWME agrees with its statement or description, nor does it constitute any investment advice. For all actions taken by visitors based on information provided by the FOLLOWME community, the community does not assume any form of liability unless otherwise expressly promised in writing.
FOLLOWME Trading Community Website: https://www.followme.com


Hot
No comment on record. Start new comment.