USD/TRY Price Analysis: Sellers remain active near 9.6000 resistance zone

- USD/TRY shrugs off the previous day’s gains on Friday in the early European session.
- The cross-currency pair remains pressured near 9.6000 for the past three-session.
- Receding momentum oscillator warns caution before placing aggressive bids.
USD/TRY edges lower on the last day of the trading week. The pair stayed in a very narrow trade band with no meaningful direction. At the time of writing, USD/TRY is trading at 9.5362, down 0.07% for the day.
USD/TRY daily chart
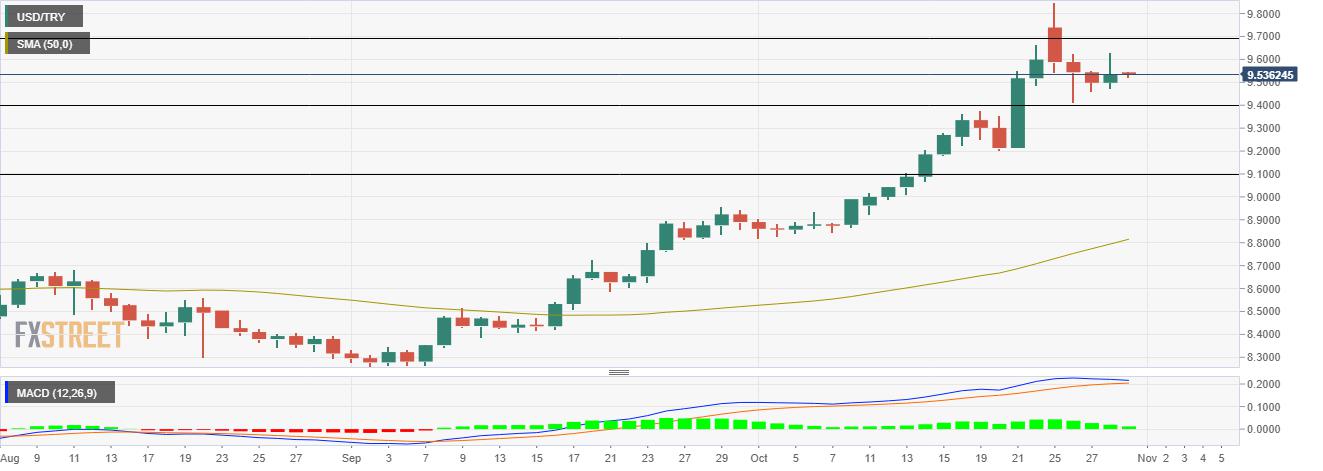
On the chart, the USD/TRY cross-currency pair has been in the upside momentum since September 7. The pair traded in a close trade band of 9.4000 and 9.6000 since it peaked to an all time high on Monday at 9.8505.
If the price breaks below the intraday low it could again test the 9.4000 horizontal resistance level and then keep an eye on the October 21 low of 9.2098. Furthermore, The Moving Average Convergence Divergence (MACD) indicator holds onto the overbought zone with stretched buying conditions. Any downtick in the MACD could bring the 9.1000 horizontal support zone back into picture.
Alternatively, if the price reverses direction, it could first test the previous session’s high at 9.6317, followed by the 9.7000 horizontal resistance zone line. A daily close above the mentioned level would explore the possibility of 9.8505 (Monday high).
Reprinted from FXStreet_id,the copyright all reserved by the original author.
Disclaimer: The content above represents only the views of the author or guest. It does not represent any views or positions of FOLLOWME and does not mean that FOLLOWME agrees with its statement or description, nor does it constitute any investment advice. For all actions taken by visitors based on information provided by the FOLLOWME community, the community does not assume any form of liability unless otherwise expressly promised in writing.
FOLLOWME Trading Community Website: https://www.followme.com


Hot
No comment on record. Start new comment.