Euro vs. North America

USD Daily
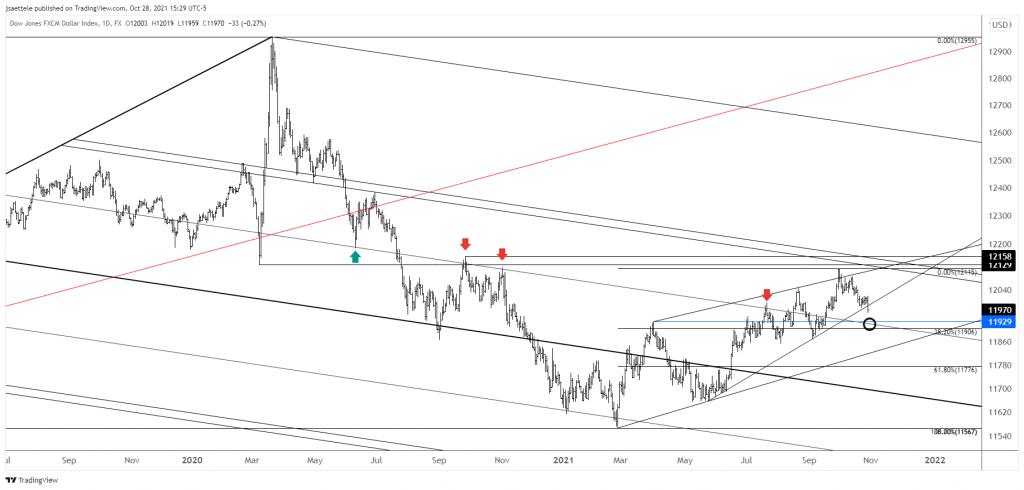
USDOLLAR traded 12019 today before dumping the rest of the day. Today’s decline completes a wedge from the February low. That’s really bearish so the implication is that the longer term USD downtrend has resumed. This is difficult for me to reconcile though with AUDUSD showing 5 waves up and extremely well-defined resistance slightly higher (see 10/26 post for AUDUSD chart). Maybe this next leg of USD weakness will be driven by EURUSD strength? In any case, the next possible bounce level for USDOLLAR is probably 11920s (parallel and April high).
10/21 – USDOLLAR turned up from corrective channel support. Again, my ‘view’ is that the buck has rolled over so I’ll be paying close attention to sentiment in the coming days. For example, strong USD forecasts would suggests that it’s time to short the USD. Price wise, pay attention to 12020s and 12060s for resistance.
EUR/USD Daily
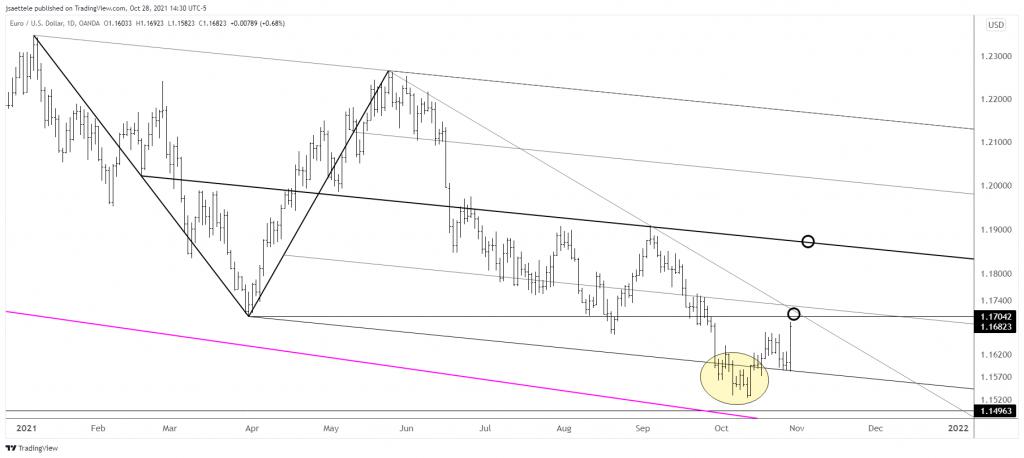
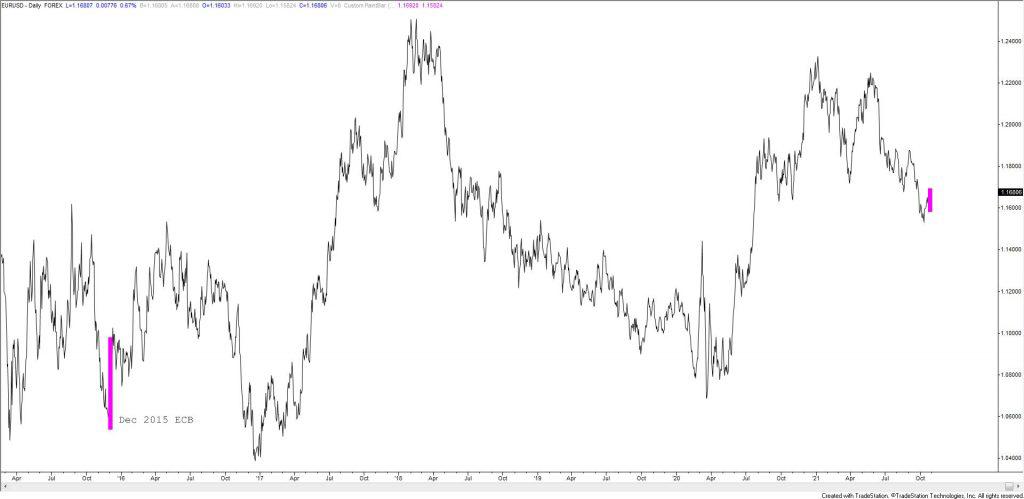
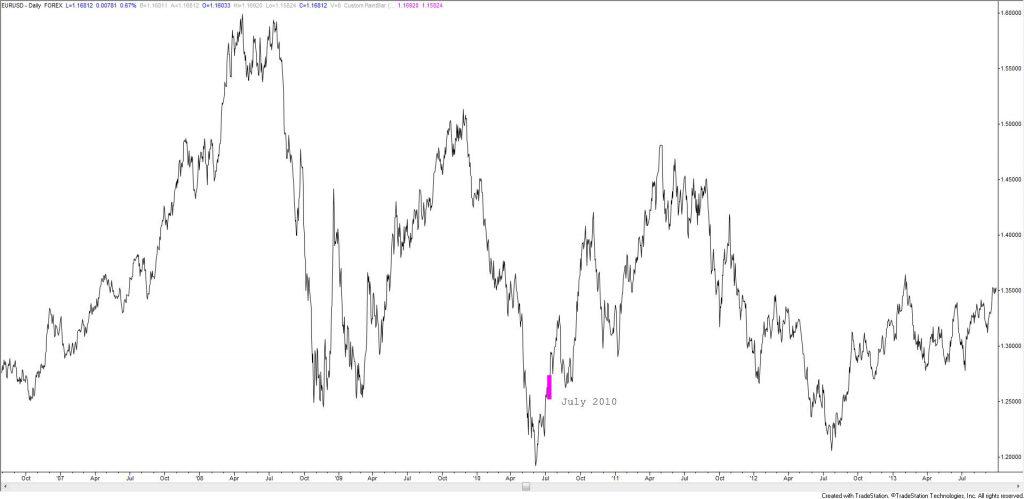
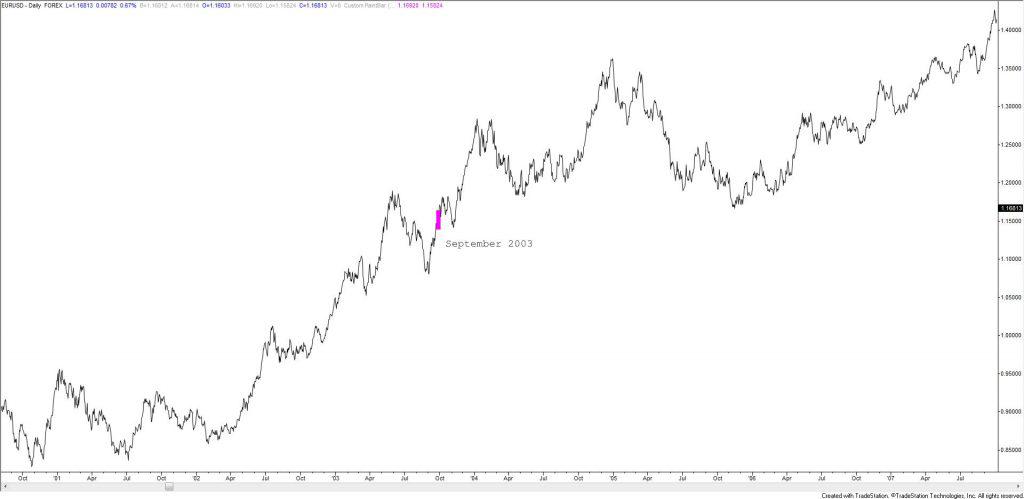
Remember the channel from the January high? EURUSD has confirmed a false break below the channel…which is bullish (low of the last 3 days is right at the channel line). Near term, I’m thinking 1.0700/30 puts up a fight. If it does, then watch for support near 1.0640. The next 3 charts show instances when EURUSD made a 5 day low and 20 day high on the same day. Today is just the 4th time that has happened since the euro’s inception. In the previous 3 instances, the ‘show of strength’ day (Wyckoff term) preceded large advances although not necessarily right away.
10/27 – No change to EURUSD as the near term wave count continues to play out. Again, I’m looking for a higher low near 1.1570. This could of course happen in spike fashion with ECB tomorrow. Initial upside focus is 1.1700/30. This is trendline resistance and the March low (see daily chart below).
EUR/USD Daily
EUR/USD Daily
EUR/USD Daily
USD/MXN Daily
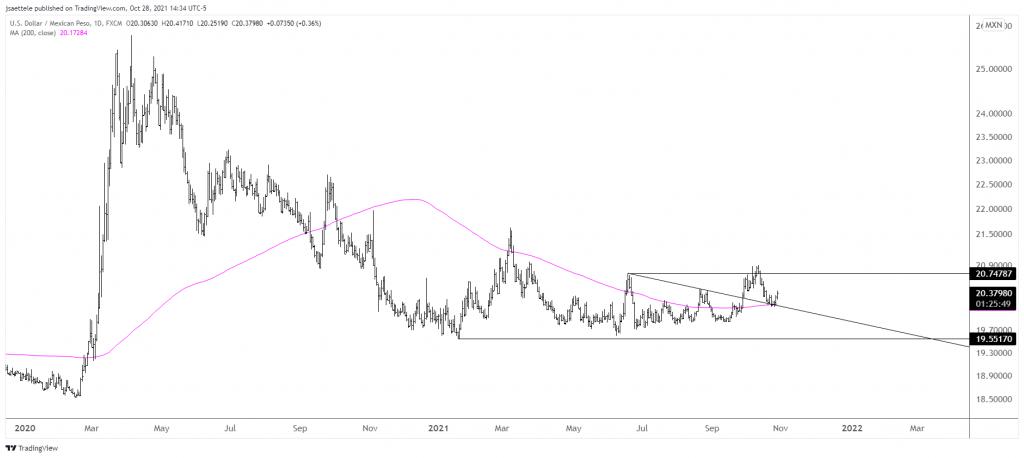
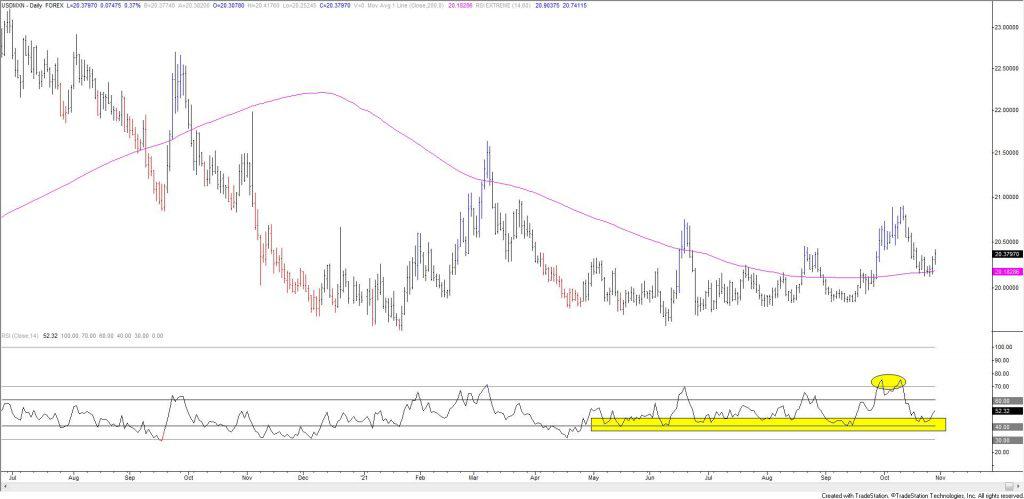
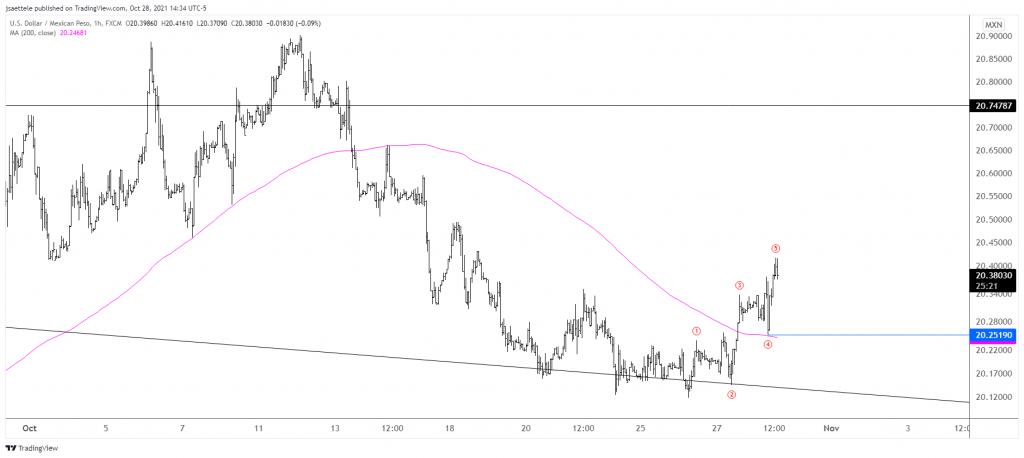
USDMXN has turned up from the 200 day average and top side of the line off of the June and August highs. What’s more, the daily RSI profile is in bullish mode (see below). This means that price lows have occurred with readings above 30 (usually near 40) and price highs have occurred with readings above 70. There are 5 waves up from this week’s low so focus is on buying a pullback near 20.25.
USD/MXN Daily
USD/MXN Hourly
USD/ZAR Daily
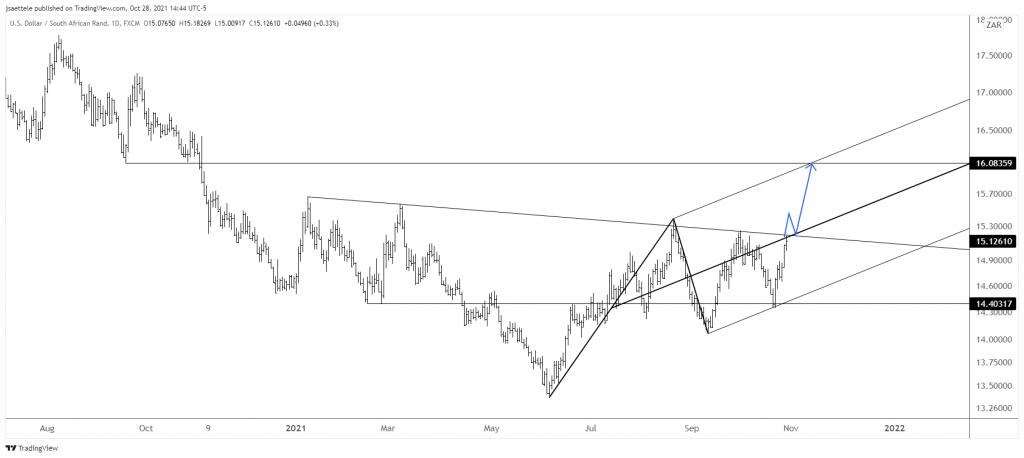
Is this a year long head and shoulders bottom in USDZAR? Price is testing the neckline now. Price is also testing the center line of the channel from the June low. This confluence (neckline and center line) constitutes an ‘energy point’, which warns of increased volatility. If price breaks higher then my preferred method of entry is to buy a pullback to the top side (as outlined with the arrows).
EUR/CAD Daily
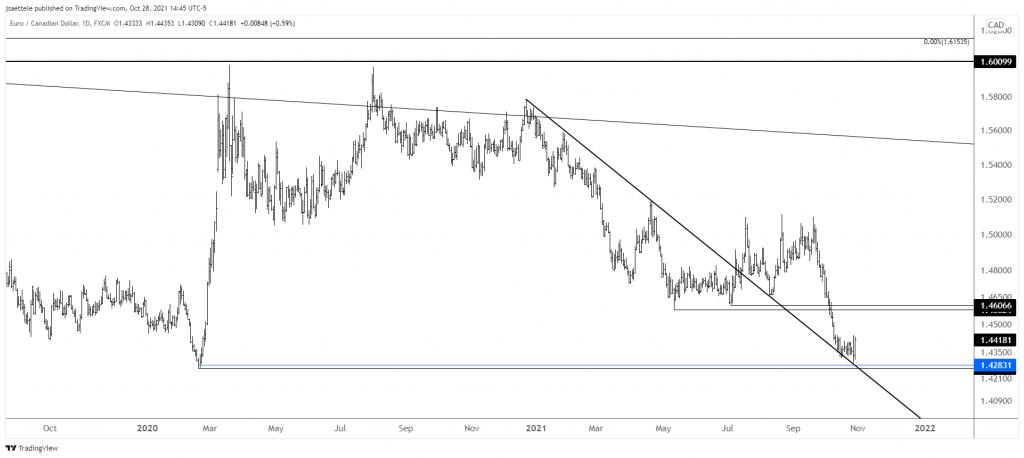
EURCAD has turned up from former trendline resistance turned support and is in the process of putting in a weekly reversal. Near term (not shown), I’d like to see 5 waves up from the low before plotting an entry. Stay tuned for that development. Finally, the charts are suggesting long euro against North America…definitely not a popular view and therefore interesting.
Reprinted from FXStreet,the copyright all reserved by the original author.
Disclaimer: The content above represents only the views of the author or guest. It does not represent any views or positions of FOLLOWME and does not mean that FOLLOWME agrees with its statement or description, nor does it constitute any investment advice. For all actions taken by visitors based on information provided by the FOLLOWME community, the community does not assume any form of liability unless otherwise expressly promised in writing.
FOLLOWME Trading Community Website: https://www.followme.com


Hot
No comment on record. Start new comment.