How did landlords fare during COVID?

The COVID-19 pandemic hit renters harder than homeowners,1 leading policy makers to try to help renters with eviction moratoriums and billions of dollars of rental assistance. Given the critical role that landlords play in providing rental housing and their dependence on rental income, it is important to understand not just how the pandemic has affected tenants, but also the financial health of landlords.
Moreover, landlords give us a much-needed window into rent payment trends, which have been difficult to evaluate during the pandemic. Unlike the very centralized mortgage market, the rental market is disaggregated and largely made up of small to medium sized landlords. Large-scale representative data on rent payments do not exist.2 Of the nearly 50 million rental housing units, almost half are in rental properties with only one to four units and almost three-quarters of rental properties (41 percent of rental units) are owned by individual investors.3 Smaller landlords are especially important because landlords that own and operate two to four and five to fifty unit buildings provide most of the nation’s existing affordable housing stock.4
The financial health of landlords often crucially depends on their rental income. A Brookings Institute analysis of the Rental Housing Finance Survey finds that one-third of individual investor landlords are from low- to moderate-income households where their property income constitutes up to 20 percent of their total household income.5 In addition, the Urban Institute analyzed American Community Survey data to find that roughly a third of landlords of two-to-four-unit buildings are older than 65, meaning they are mostly retired and unlikely to have another source of income.6 Regardless of whether a tenant can make rent payments, landlords have costs related to their rental property such as mortgages, taxes, utilities, and maintenance expenses. While there is some flexibility in certain costs such as maintenance and mortgage payments (due to widespread forbearance), others (e.g., taxes) must be paid.
While many renters have been unable to continue paying rent because of the economic impact of the pandemic, policies aimed at helping renters might also threaten the financial health of landlords. Some have worried that eviction moratoriums might result in tenants not paying rent even when they have the means to do so, though evidence is limited. Almost $50 billion of rental assistance is available from the Emergency Rental Assistance Program and the American Rescue Plan Act, but distribution of the funds has been slow7 and landlords cannot apply for assistance without the tenant as a cosigner.
Using JPMorgan Chase small business and personal deposit account and mortgage servicing data, we examine how small to medium sized landlords fared during the pandemic. We evaluate their rental revenues, expenses, and balances using two samples: (1) landlord business owners: small business account holders who have indicated that they are a lessor of a residential property, and (2) rental property owners: Chase deposit account holders who also have a Chase mortgage on a multifamily or investment property. Our samples allow us to study smaller landlords and compare against pre-pandemic trends.
We find evidence that landlords lost rental revenue during the pandemic, especially in the spring of 2020 when rental revenue for the median landlord was down about 20 percent relative to 2019. Revenues recovered quickly and the median landlord ended 2020 with a modest decline of 3 percent in rental revenue compared to 2019. Our data does show that a larger share of landlords experienced a decline of more than 10 percent in revenues during the pandemic (38 percent in 2020 vs. 34 percent in 2019) but most of the volatility appears to be normal year-to-year volatility. Importantly, as revenues were declining, landlords cut expenses by an amount greater than their rental income declined, which resulted in overall higher cash balances. We find the financial outcomes of landlords varied across cities: landlords in San Francisco, New York, and Miami–and specifically the core city centers in those areas–experienced the greatest declines in rental revenues while landlords in Phoenix, Houston, and Dallas collected the same amount or more rental income in 2020 than 2019. For those with mortgages, part of the cost cutting came through taking advantage of widely available mortgage forbearance programs with up to 10 percent of landlords opting into forbearance and 7 percent missing payments. In general, landlords in cities with greater declines in rental revenues were more likely to cut costs and more likely to miss mortgage payments.
Unprecedented government support through programs such as unemployment insurance (UI) and economic impact payments (EIP) during the pandemic likely provided needed relief to renters and helped to prevent a worse outcome for landlords. However, the larger cash buffers landlords built during the pandemic are misleading as an indicator of financial health. While many landlords were able to pull back on expenses as revenues declined, in many instances, they are simply delaying costs that they will need to make up down the road. Missed mortgage payments will need to be paid eventually and deferred maintenance could result in higher costs later if the fixes were preventative. Furthermore, a slightly larger share of landlords than normal experienced substantial declines in rental income. For this pocket of the landlord population, the challenging task of getting rental relief that has already been allocated out faster will be critical to both making them whole and staving off eviction for their tenants.
Data and Analytics
We use de-identified administrative data on Chase small business, mortgage, and deposit account customers to find two samples of landlords. As shown in Table 1, we construct two distinct samples of landlords. The first is a sample of roughly 18,000 landlord business owners, who have a Chase business checking account and self-identify their industry as Lessors of Residential Buildings and Dwellings. This sample of landlord business owners gives us a relatively clean view of landlord-related revenues and expenses and is the source of insight for Findings 1 and 2 on broad trends in rental revenues, expenses, and balances.
The second sample of landlords is a group of roughly 32,000 rental property owners who have a Chase mortgage on an investment or multifamily property as well as a Chase personal checking account. The strength of this sample is that we are able to observe whether these landlords missed mortgage payments on the rental property, an indicator of financial hardship and the focus of Finding 3. In addition, this sample allows us to characterize the household financial attributes of landlords.
A caveat with this sample is that the personal deposit accounts likely mix landlord- and household-related activity. We attempt to isolate potential rental payments removing as many other types of inflows (e.g., direct deposit labor income, UI payments, tax refunds, etc.) as possible. Based on manual inspection of the relevant transactions as well as summary statistics of our data8, we are confident that a large majority of the remaining inflows are highly likely to be rent payments. However, we also believe that there is more noise in the rent payment measure for this sample than for the landlord business owners sample. Therefore, the vast majority of our analysis of rental revenues for landlords will be based on the landlord business owners sample.
Table 1: Requirements and descriptions for two samples of landlords
Sample 1: Landlord business owners |
Sample 2: Rental property owners |
|---|---|
Sample: 17,646 landlords
|
Sample: 32,152 landlords
|
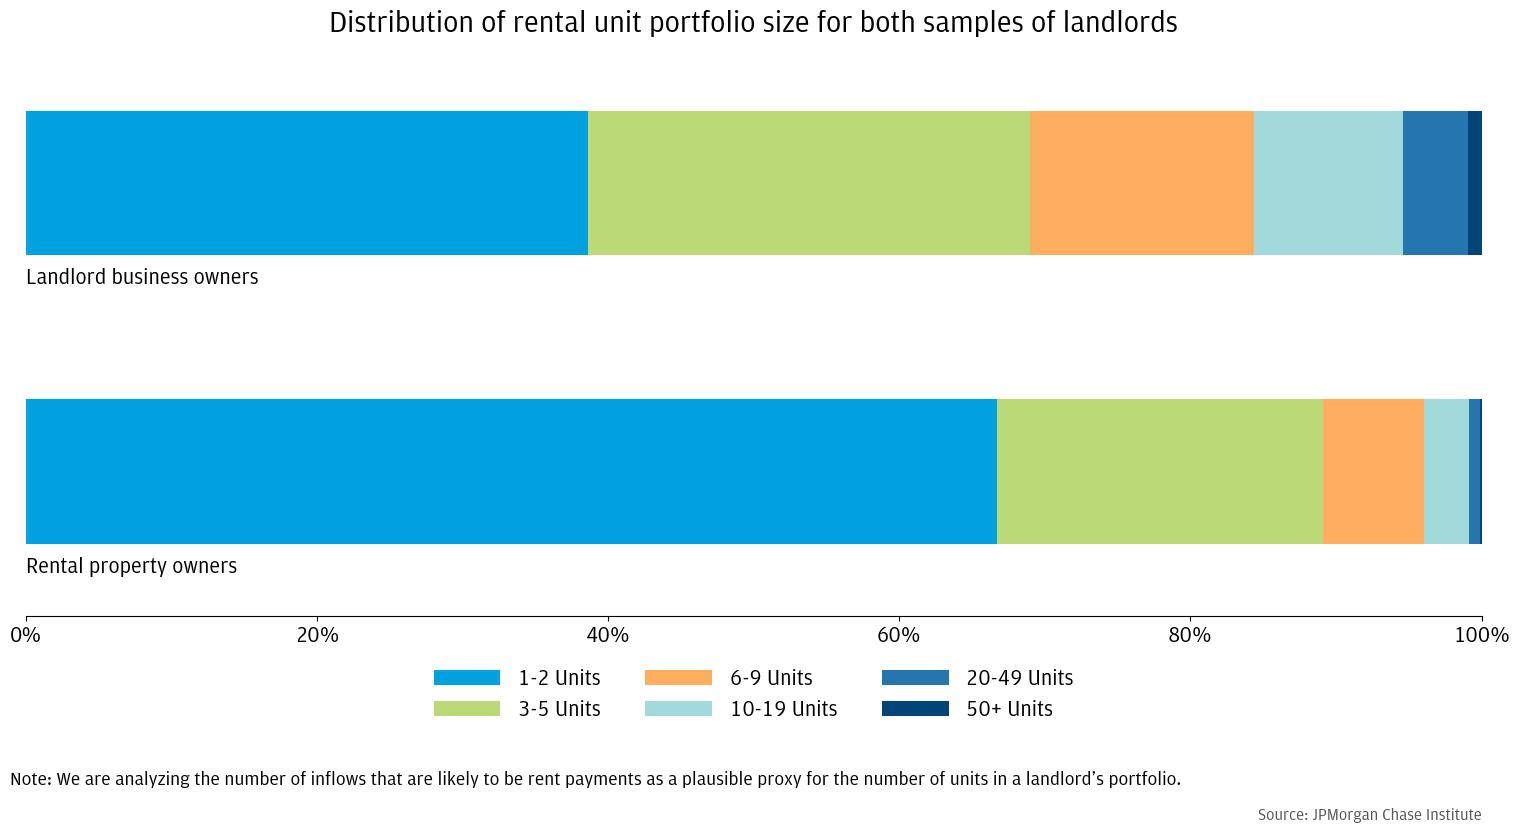
The median landlord in our landlord business owner sample has 4 to 5 rental revenue inflows per month with each inflow being approximately $1300. If we assume that each inflow represents one rental unit, this sample skews toward smaller landlords, but there is also a range of sizes represented. Thirty eight percent are very small landlords with 1-2 inflows, almost half have between 3 and 9 inflows, and 16 percent have over 10 inflows with just one percent above 50 inflows (Figure 1).
In contrast, judging by the number of inflows that could represent rental payments, the sample of rental property owners is composed of even smaller landlords. The median landlord receives just 2 rental inflows per month with each inflow being approximately $1,200. The majority (67 percent) in this sample has just 1-2 inflows, 22 percent have 3-5 inflows, and the bulk of the remainder (7 percent) have 6-9 inflows. Only 4 percent of this sample have more than 10 inflows. (Figure 1)
Figure 1: The rental property owners skew more towards smaller landlords than the landlord business owners sample, but for both samples, most landlords have 5 or fewer rental inflows (implying 5 or fewer units in their portfolio).
Because the landlords in our rental property owners sample are receiving their rental inflows in their personal deposit account, we can examine other activity in that account to learn more about their financial lives. Most have other income in addition to their rental income. About 54 percent receive direct deposit labor income and of those that do, they receive about $5,200 of after-tax direct deposit labor income per month. Total monthly inflows (excluding transfers) for these landlords is about $8,000, meaning that rental income (about $2500) is about 31 percent of their total income. The median landlord has over $22,000 in their checking account.
Table 2: For rental property owners, more than half receive direct deposit labor income and rental income is about 31 percent of all inflows excluding transfers.
All Rental Property Owners |
|
|---|---|
Potential Rental Income in 2019 |
|
| Median Number of Inflows per Month | 2 |
| Median Amount of Each Inflow | $1,220 |
| Median Total Potential Rental Income | $2,512 |
Other Income in 2019 |
|
| Percentage Receiving Direct Deposit Labor Income | 54% |
| Median Monthly Direct Deposit Labor Income* | $5,236 |
| Median Monthly Total Inflows except Transfers** | $8,012 |
Balances in 2019 |
|
| Median Household Balance | $22,559 |
*conditional on receipt of deposit labor income
**including rental income
Reprinted from JP Morgan,the copyright all reserved by the original author.
Disclaimer: The content above represents only the views of the author or guest. It does not represent any views or positions of FOLLOWME and does not mean that FOLLOWME agrees with its statement or description, nor does it constitute any investment advice. For all actions taken by visitors based on information provided by the FOLLOWME community, the community does not assume any form of liability unless otherwise expressly promised in writing.
FOLLOWME Trading Community Website: https://www.followme.com


Hot
No comment on record. Start new comment.