S&P 500 Price Forecast: Triple bottom around 4,300, puts 4,650 as the next target for bulls

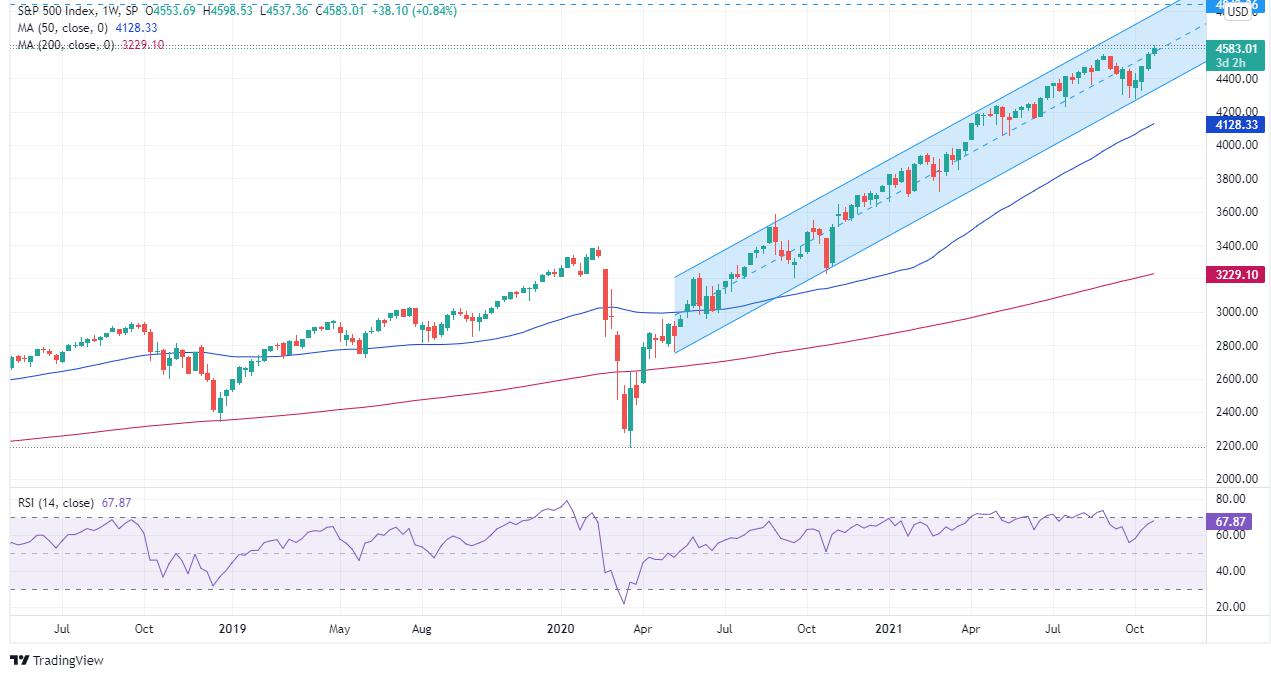
- S&P 500: A weekly close above the mid-point of an ascending channel opens the doors for a further upside move.
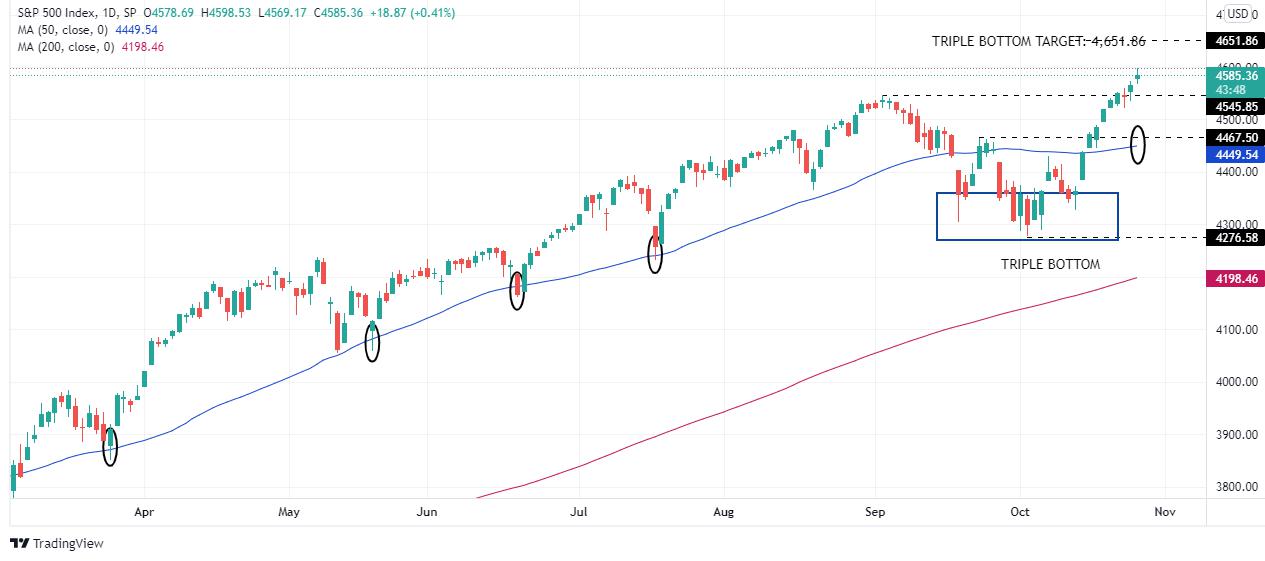
- S&P 500: A triple bottom in the daily chart puts 4,651.86 as the next upside target for bulls.
The S6P advances during the New York session, is up 0.35%, sitting at 4580.93 at the time of writing. The market sentiment is upbeat, portrayed by major US stock indices, rising between 0.26% and 0.35%.
Factors like solid US corporate third-quarter earnings have kept investors positive, despite elevated prices and central bank pandemic-stimulus reduction, which in part tries to curb inflationary pressures around the globe.
S&P 500 Price Forecast: Technical outlook
Weekly chart
The S&P 500 has rallied almost 112%, from March 23, 2020, until October 26, 2021. At press time, it is trading briefly above the mid-point line of an ascending channel, leaving the door open for an upward move towards the top of the ascending channel, which lies around the 4,800-4,900 area. A weekly close above the mid-line would open the door towards the abovementioned, but it would find resistance areas at the round levels, such as 4,600, followed by 4,700.
The Relative Strength Index (RSI), a momentum indicator that approaches 68, aims higher, indicating that the index still has the potential of printing another leg-up before reaching overbought levels.
Daily chart
The S&P 500 is in an overextended upward trend which has found strong support around the 50-day moving average (DMA), which has successfully supported the index eight times before resuming the upward direction. Nevertheless, on September 20, it finally breached below the 50-DMA, finding consolidation around the 4,300-4,500 area, which printed a triple bottom.
The measure of the bottom of the triple bottom to the “neckline” (if it could be called like this) is 186.46 points, which added to the September 23 high at 4,465.40, puts the 4,651.86 figure as the next upside target for the S&P 500.
In the outcome of a downward correction, the first support would be the September 2 high at 4,545.85, followed by the September 23 high at 4,465.40.
The Relative Strenght Index (RSI) is at 69. Edces slightly up, indicates that the S&P 500 might consolidate, before printing another leg-up.
Reprinted from FXStreet,the copyright all reserved by the original author.
Disclaimer: The content above represents only the views of the author or guest. It does not represent any views or positions of FOLLOWME and does not mean that FOLLOWME agrees with its statement or description, nor does it constitute any investment advice. For all actions taken by visitors based on information provided by the FOLLOWME community, the community does not assume any form of liability unless otherwise expressly promised in writing.
FOLLOWME Trading Community Website: https://www.followme.com


Hot
No comment on record. Start new comment.