EUR/USD Price Analysis: 21-DMA support appears at risk amid bearish RSI

- EUR/USD is clinging onto the 21-DMA support, downside appears compelling.
- RSI inches lower below the midline, pointing to additional losses for the pair.
- 1.1700 remains a tough nut to crack for the EUR bulls, with all eyes on ECB.
EUR/USD is holding steady around 1.1600, lacking any bullish potential amid a broadly stronger US dollar.
The greenback resumes its Monday’s recovery rally, as the US Treasury yields pause their latest corrective pullback.
Mixed market sentiment, in the wake of growing inflation fears, strong American earnings reports and US stimulus progress, keeps the dollar’s safe-haven appeal underpinned.
The pair now awaits Thursday’s European Central Bank (ECB) monetary policy decision to break out of the recent 1.1570-1.1670 price range.
In the meantime, the divergent monetary policy outlooks between the Fed and the ECB could continue to undermine the euro.
Looking at EUR/USD’s daily chart, the bulls have been defending the critical short-term 21-Daily Moving Average (DMA) at 1.1600 since October 20.
Meanwhile, the upside attempts are guarded by the 1.1670 supply zone.
Now, with the 14-Day Relative Strength Index (RSI) edging lower below the midline, the major is likely to extend Monday’s sell-off towards the previous week’s low of 1.1571.
If the latter gives way, then the floors will open up towards the yearly troughs of 1.1524.
EUR/USD: Daily chart
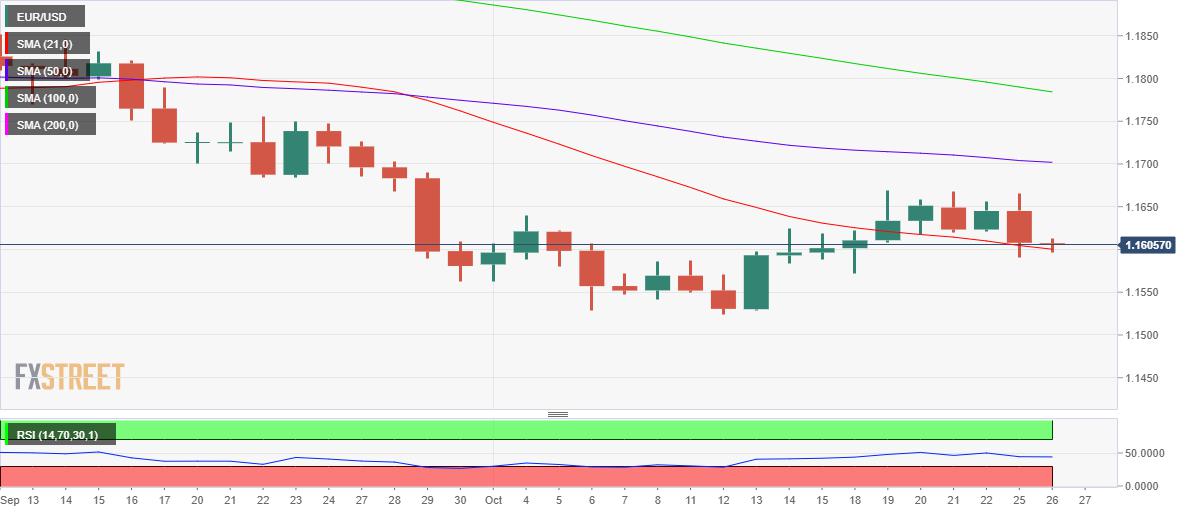
Alternatively, gold bulls await acceptance above the recent range highs near 1.1670, above which the 1.1700 threshold will come into play, where the mildly bearish 50-DMA hangs around.
The next stop for EUR buyers is seen at the 1.1750 psychological level.
EUR/USD: Additional levels to consider
Reprinted from FXStreet_id,the copyright all reserved by the original author.
Disclaimer: The content above represents only the views of the author or guest. It does not represent any views or positions of FOLLOWME and does not mean that FOLLOWME agrees with its statement or description, nor does it constitute any investment advice. For all actions taken by visitors based on information provided by the FOLLOWME community, the community does not assume any form of liability unless otherwise expressly promised in writing.
FOLLOWME Trading Community Website: https://www.followme.com


Hot
No comment on record. Start new comment.