GBP/USD Price Analysis: Buyers defends 1.3750 below 100-day SMA

- GBP/USD edges higher on the first trading day of the week in the Asian trading hours.
- The pair faces strong resistance near 1.3850 below the bearish sloping line.
- MACD signals sideways momentum with the underlying neutral sentiment.
GBP/USD trades cautiously on Monday following the previous session's decline. The pair stayed in a narrow range band with an upside bias. At the time of writing, GBP/USD is trading at 1.3763,up 0.08% for the day.
GBP/USD daily chart
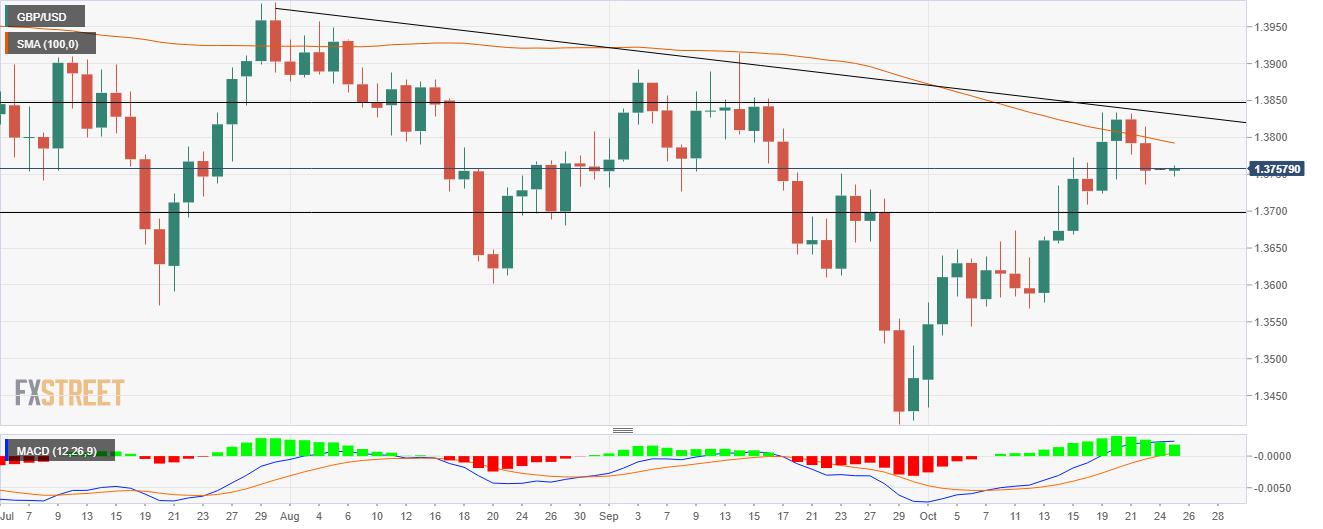
On the daily chart, the GBP/USD pair has been in the continuous downward trend since the high made on July 30 at 1.3983. The descending trendline from the mentioned level acts as a strong barrier for GBP/USD. Further, the spot trades below the 100-day Simple Moving Average (SMA) at 1.3792, which strengthen the current downside momentum.
If the pair sustains the intraday high it could go back to test the psychological 1.3800 mark, breaking above the 100-day SMA. A successful break of the 100-day SMA could pave way for the 1.3850 horizontal resistance level.
The Moving Average Convergence Divergence (MACD) indicator holds above the midline. Any uptick in the MACD could bring more upside momentum for the spot. The bulls would approach the psychological 1.3900 level in that case.
Alternatively, a break below the intraday’s low would result in the continuation of the prevailing trend with the first downside target at Tuesday’s low of 1.3723 followed by the 1.3700 horizontal support zone.
Next, the bears would not mind taking out the low made on October 14 at 1.3655.
GBP/USD additional levels
Reprinted from FXStreet_id,the copyright all reserved by the original author.
Disclaimer: The content above represents only the views of the author or guest. It does not represent any views or positions of FOLLOWME and does not mean that FOLLOWME agrees with its statement or description, nor does it constitute any investment advice. For all actions taken by visitors based on information provided by the FOLLOWME community, the community does not assume any form of liability unless otherwise expressly promised in writing.
FOLLOWME Trading Community Website: https://www.followme.com


Hot
No comment on record. Start new comment.