USD/TRY Price Analysis: Seesaws inside bullish pennant surrounding $8.9000

- USD/TRY holds lower ground inside a bullish chart pattern.
- MACD hints at a short-term pullback, 100-SMA adds to the downside support.
- Recent highs, the previous support line lure the bulls.
USD/TRY remains pressured around the intraday low, down 0.12% on a day close to $8.87 by the press time of the pre-European session on Thursday.
In doing so, the Turkish Lira (TRY) pair takes rounds to a bullish pennant on the four-hour (4H) chart.
Although MACD teases sellers, a pennant’s support near $8.86 would question the short-term downside of the pair, a break of which will highlight the 100-SMA level of $8.76.
Even if the quote drops below $8.76, September 20 swing high surrounding $8.73 will add to the downside filters.
Meanwhile, an upside clearance of $8.93 level will confirm the bullish formation, directing the USD/TRY towards the support-turned-resistance from September 16, near $9.00. It’s worth noting that the latest high of $8.96 act as an extra resistance.
Overall, USD/TRY has more upside potential but the bull may take intermediate rests.
USD/TRY: Four-hour chart
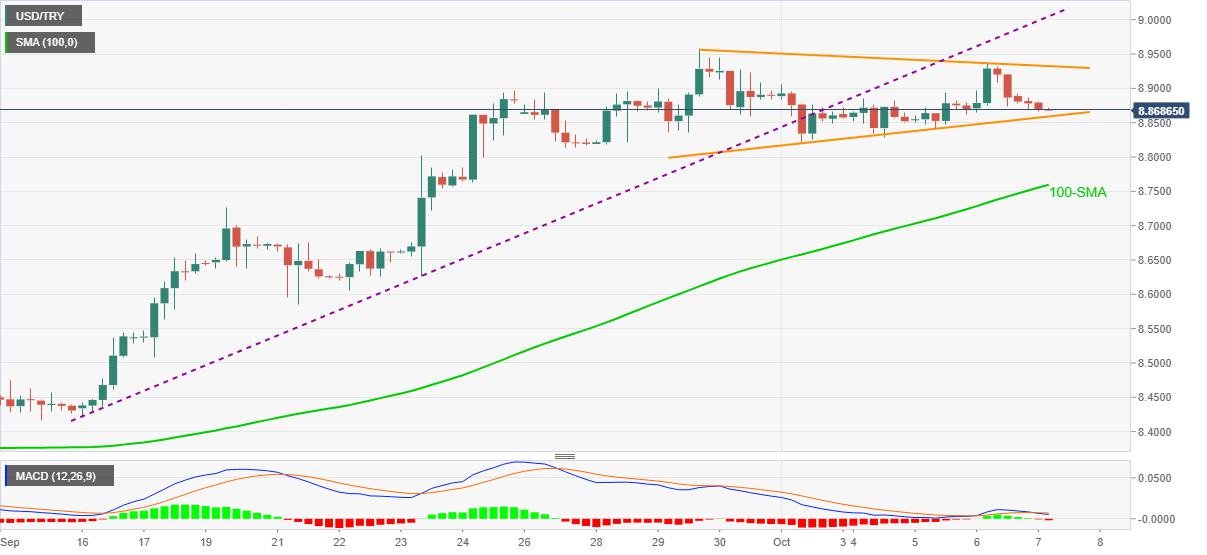
Trend: Bullish
Reprinted from FXStreet_id,the copyright all reserved by the original author.
Disclaimer: The content above represents only the views of the author or guest. It does not represent any views or positions of FOLLOWME and does not mean that FOLLOWME agrees with its statement or description, nor does it constitute any investment advice. For all actions taken by visitors based on information provided by the FOLLOWME community, the community does not assume any form of liability unless otherwise expressly promised in writing.
FOLLOWME Trading Community Website: https://www.followme.com


Hot
No comment on record. Start new comment.