高低点分析:恒生指数短线看涨至28414.90

本文来源于图表家
高低点信号旨在寻找一定周期内价格走势的高点和低点,是基于支撑阻力形成的图形化分析方法。以高点为例,在确认高点后认为价格下行概率较大,建议进场做空,止损价为信号识别的高点水平。
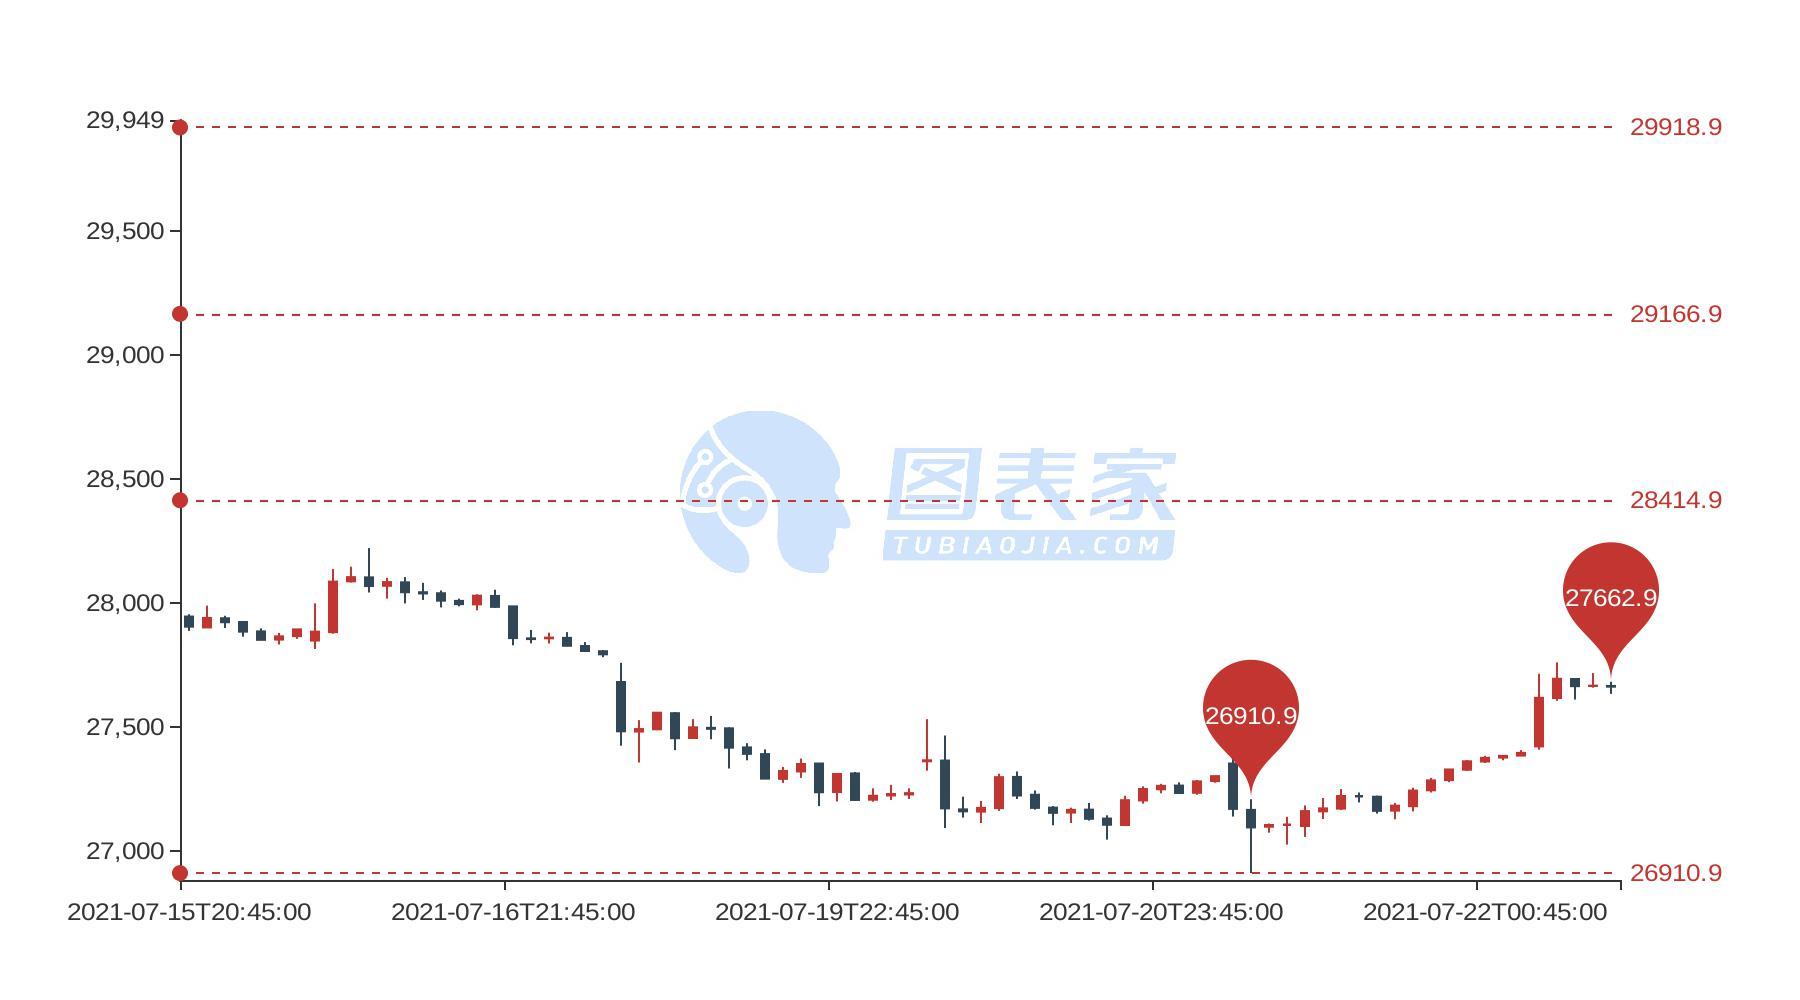
图为恒生指数1小时走势,价格在27662.9水平出现高低点看涨信号,上涨目标首见28414.90,进一步目标见29166.90和29918.90。
若价格下行且跌破低点26910.9,则该看涨信号失效。
Reprinted from 金十数据,the copyright all reserved by the original author.
Disclaimer: The content above represents only the views of the author or guest. It does not represent any views or positions of FOLLOWME and does not mean that FOLLOWME agrees with its statement or description, nor does it constitute any investment advice. For all actions taken by visitors based on information provided by the FOLLOWME community, the community does not assume any form of liability unless otherwise expressly promised in writing.
FOLLOWME Trading Community Website: https://www.followme.com


Hot
No comment on record. Start new comment.