AUD/NZD Price Analysis: Bulls seek upside validation near 1.0640

- AUD/NZD opens higher in the early Asian session.
- Cross manages to hold onto the multi-month low near 1.0600.
- Momentum oscillator in oversold zone, potential reversal toward upside.
AUD/NZD price continues to consolidate within the previous day trading range on Friday. The cross successfully held onto the 1.0600 level after a single day fall of more than 100-pips on Wednesday.
At the time of writing, the AUD/NZD is trading at 1.0629, up 0.07% on the day.
AUD/NZD daily chart
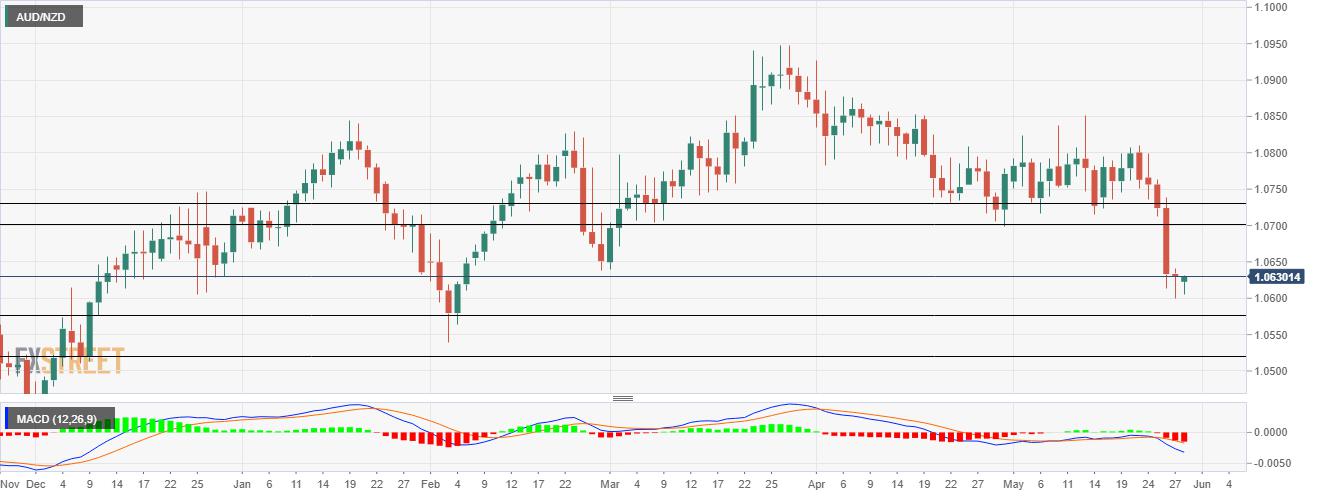
On the daily chart, the pair is gaining momentum after the formation of a hammer candlestick, which is a bullish formation. The bulls would likely extend gains toward the previous day’s high at 1.0640. The broader channel formation between 1.0600-1.0725 continues to be the playground for price action.
The Moving Average Convergence Divergence (MACD) indicator reads below the midline with stretched selling opportunities. A slight uptick in the MACD would trigger fresh buying optimism. AUD/NZD bulls would likely visit the early February levels, and touch a high of 1.0655 (February 5).
Market participants would try to push price higher to the 1.0700 horizontal resistance level next.
Alternatively, if price remained below the intraday low of 1.0605, then the downward momentum could continue with the first stop at the 1.0575 horizontal support level, followed by the February 3 low at 1.0539.
The next area of support would be the 1.0520 horizontal support level.
AUD/NZD Additional Levels
Reprinted from FXStreet_id,the copyright all reserved by the original author.
Disclaimer: The content above represents only the views of the author or guest. It does not represent any views or positions of FOLLOWME and does not mean that FOLLOWME agrees with its statement or description, nor does it constitute any investment advice. For all actions taken by visitors based on information provided by the FOLLOWME community, the community does not assume any form of liability unless otherwise expressly promised in writing.
FOLLOWME Trading Community Website: https://www.followme.com


Hot
No comment on record. Start new comment.