EUR/USD Price Analysis: Volatile within range near 1.2200 amid light trading

- EUR/USD whipsaws amid a lack of fresh catalysts, holiday-thinned conditions.
- The spot faces rejection near key resistance on the hourly chart.
- The DXY recovery appears to cap the upside in the major.
EUR/USD is paring back gains in the European session, having failed to find acceptance above 1.2200 in the last hour.
The major comes under fresh selling pressure, as the US dollar stages a bounce across the board amid a caution tone seen in the European stocks. The US dollar index recaptures 90.00, reversing a dip to 89.89.
The main currency pair quickly fell to daily lows of 1.2172 before recovering to 1.2192, where it now wavers. Holiday-thinned market conditions could likely be the reasons behind the whipsaw.
The spot will continue to remain at the mercy of the US dollar price action and broader market sentiment ahead of the Fedspeak.
From a near-term technical perspective, the spot turned south after facing rejection at 1.2204, the confluence of the 100 and 50-hourly moving averages (HMA).
The Relative Strength Index (RSI) takes a U-turn, now heading towards the midline, currently at 52.10, suggesting weakening upside bias.
EUR/USD hourly chart
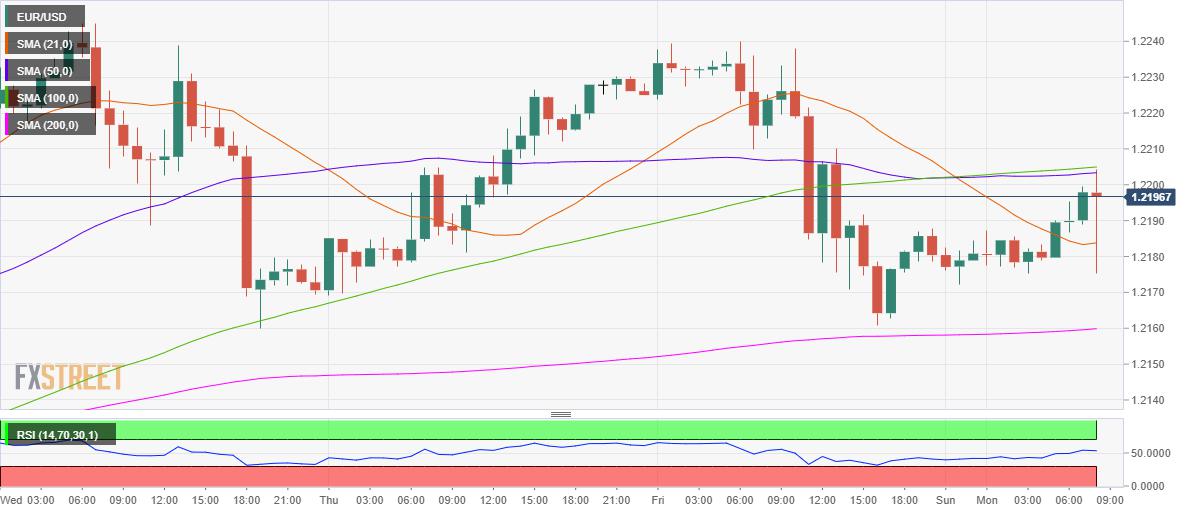
A sustained break below the 21-HMA at 1.2183 is needed to revive the sellers.
The next stop for the bears is seen at the 200-HMA at 1.2160.
On the flip side, acceptance above the 1.2204 hurdle could call for a rally towards Friday’s high of 1.2240.
EUR/USD additional levels to watch
Reprinted from FXStreet_id,the copyright all reserved by the original author.
Disclaimer: The content above represents only the views of the author or guest. It does not represent any views or positions of FOLLOWME and does not mean that FOLLOWME agrees with its statement or description, nor does it constitute any investment advice. For all actions taken by visitors based on information provided by the FOLLOWME community, the community does not assume any form of liability unless otherwise expressly promised in writing.
FOLLOWME Trading Community Website: https://www.followme.com


Hot
No comment on record. Start new comment.