GBP/JPY Price Analysis: Consolidates in a range below multi-year tops, around 154.00 mark

- A softer risk tone benefitted the safe-haven JPY and exerted some pressure on GBP/JPY.
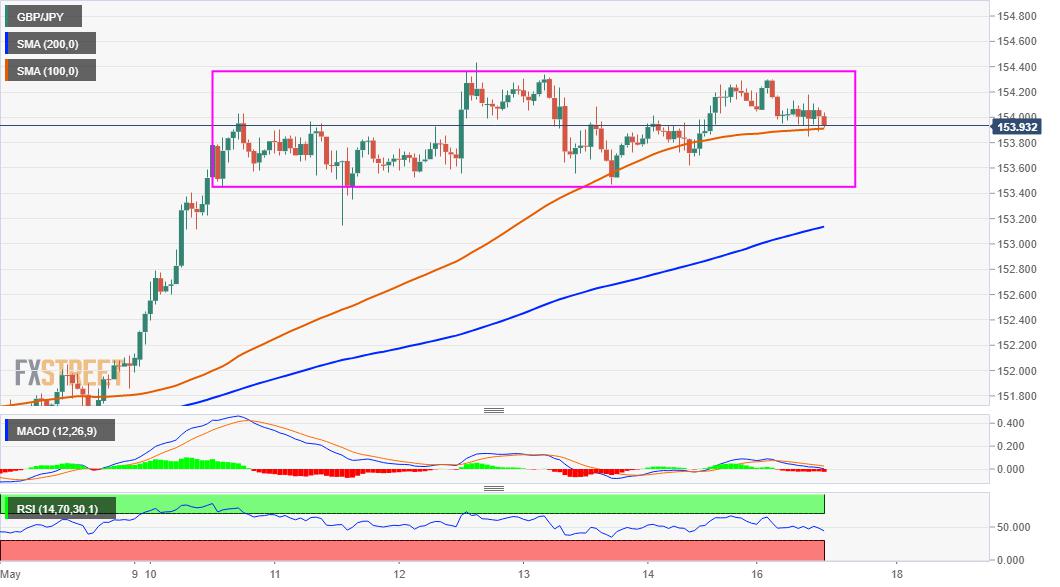
- The formation of a rectangle points to a near-term consolidation before the next leg up.
- Bullish oscillators on the daily chart support prospects for an eventual breakout to the upside.
The GBP/JPY cross traded with a mild negative bias through the first half of the European session, albeit lacked any follow-through selling. The cross, so far, has managed to hold its neck above the 154.00 mark and remained confined in a narrow trading band.
The range-bound price action over the past one week or so constitutes the formation of a rectangular chart pattern, marking a brief pause in the trend. Given the recent positive move to multi-year tops, the rectangle might still be categorized as a bullish consolidation phase.
That said, a softer risk tone around the equity markets extended some support to the safe-haven Japanese yen and capped the upside for the GBP/JPY cross. Apart from this, slightly overbought RSI on the weekly chart further held bulls from placing aggressive bets.
Meanwhile, bullish technical indicators on the daily chart, which are still far from being in the overbought territory, add credence to the constructive outlook. This, in turn, supports prospects for an eventual breakout on the upside and additional near-term gains.
Hence, any meaningful dip towards the lower end of the mentioned trading range, around the 153.55-50 region might still be seen as a buying opportunity. This should help limit the downside for the GBP/JPY cross near the 153.00 mark, or a previous strong resistance breakpoint.
On the flip side, a sustained move beyond the 154.25-30 region will be seen as a fresh trigger for bullish traders and set the stage for a move towards reclaiming the key 155.00 psychological mark. Bulls might further lift the GBP/JPY cross towards the 156.00 round figure.
GBP/USD 1-hour chart
Technical levels to watch
Reprinted from FXStreet_id,the copyright all reserved by the original author.
Disclaimer: The content above represents only the views of the author or guest. It does not represent any views or positions of FOLLOWME and does not mean that FOLLOWME agrees with its statement or description, nor does it constitute any investment advice. For all actions taken by visitors based on information provided by the FOLLOWME community, the community does not assume any form of liability unless otherwise expressly promised in writing.
FOLLOWME Trading Community Website: https://www.followme.com


Hot
No comment on record. Start new comment.