Watchlist: A busy week ahead for forex and gold on the charts

- There are a number of compelling opportunities for the week ahead according to recent price action developments.
- The US dollar and global yield differentials will be the driving force.
In a quiet start to the week, it is a perfect time to scan the market for the possible trading opportunity and to prepare for probable outcomes from a technical perspective.
First and foremost, the US dollar is one to monitor as it meets major support:
DXY, daily chart
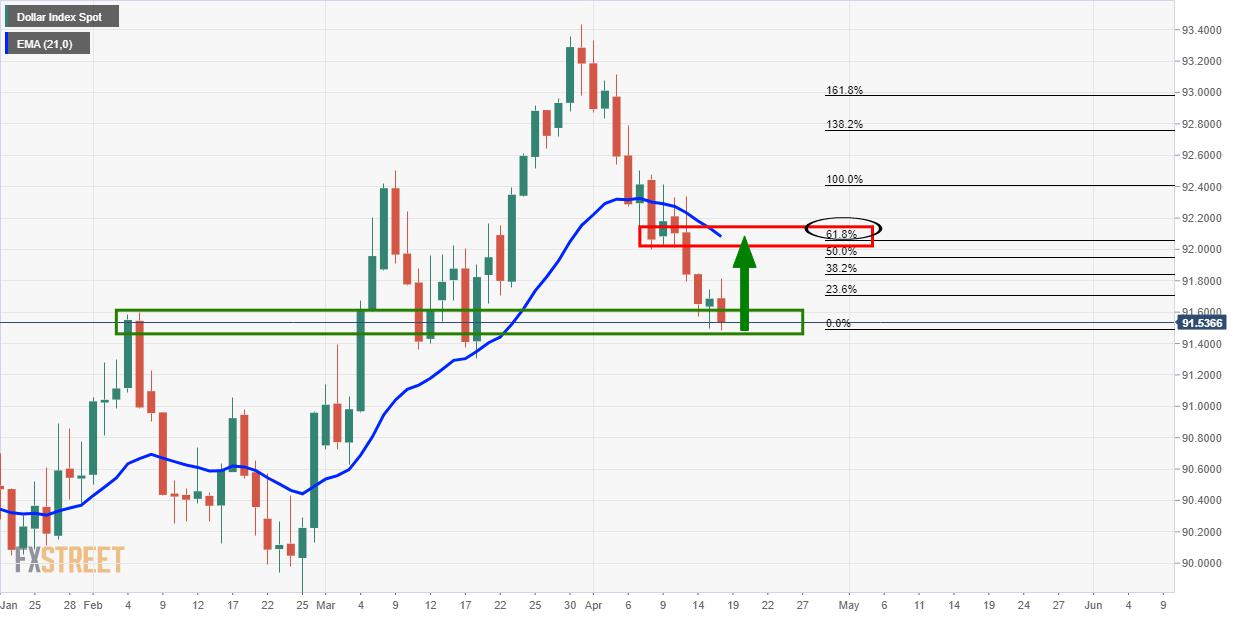
Moreover, a wider measure of dollar positioning shows that the greenback posted a net short position of $5.711 billion this week, from net shorts of $7.747 billion the week before.
There is still plenty of appetite for the greenback out there, and this is a nice sanguine into the following gold price analysis.
Gold price analysis
Gold is one of the most compelling developments in recent sessions as per Chart of the Week: Gold on the verge of a significant correction
Gold, daily chart
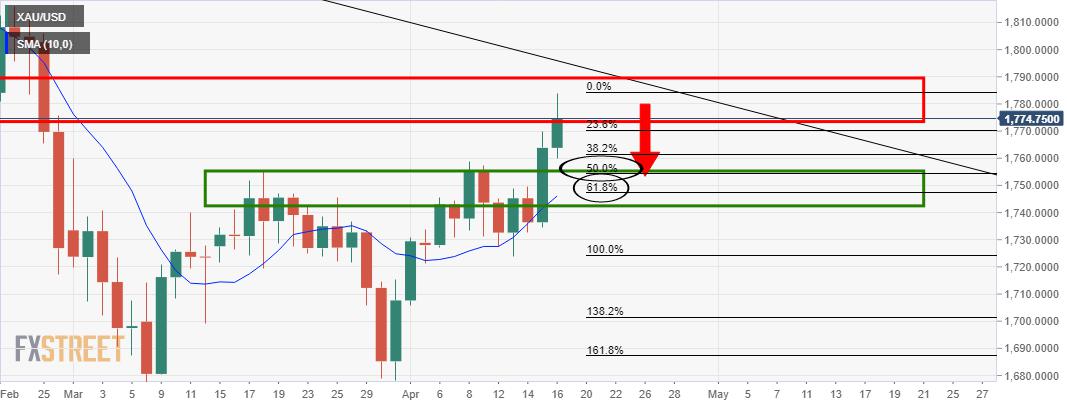
The daily chart has seen a bullish close and there can be room to go on the upside yet.
With that being said, the prior highs looking left have a confluence with a 50% mean reversion of the last few sessions of bullish closes.
A deeper 62% retracement will meet with the 21-day EMA and the neckline of the W-formation.
CAD/CHF daily chart
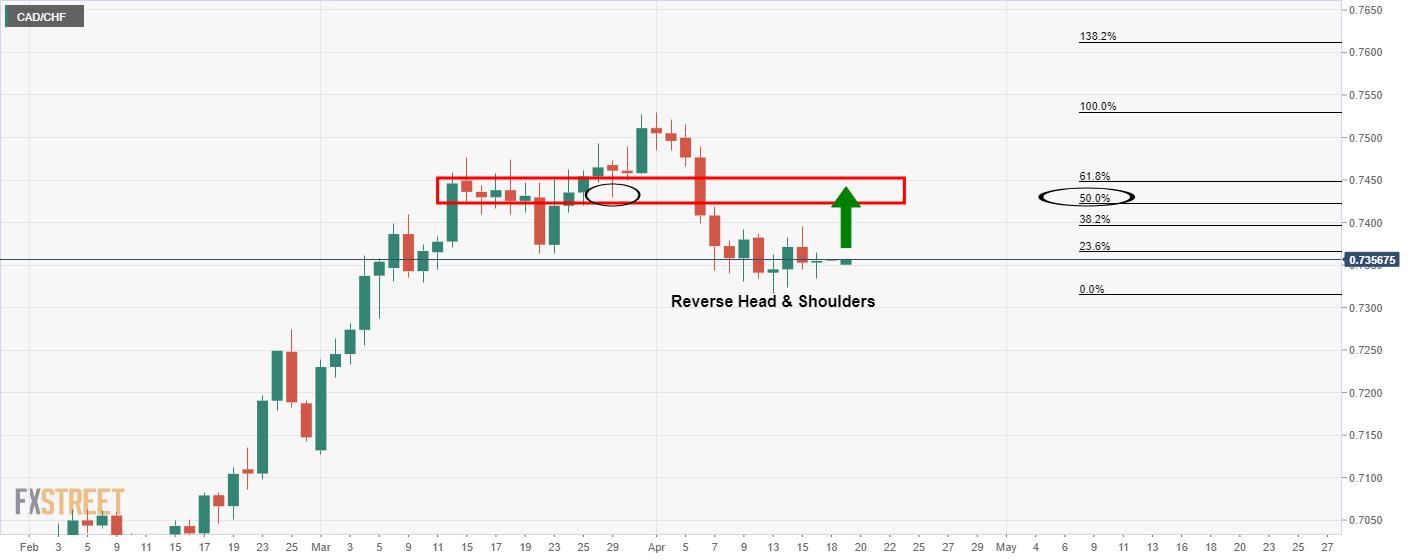
The reverse head and shoulders is a bullish pattern and there is a confluence of old support that meets a 50% mean reversion target.
EUR/AUD daily chart
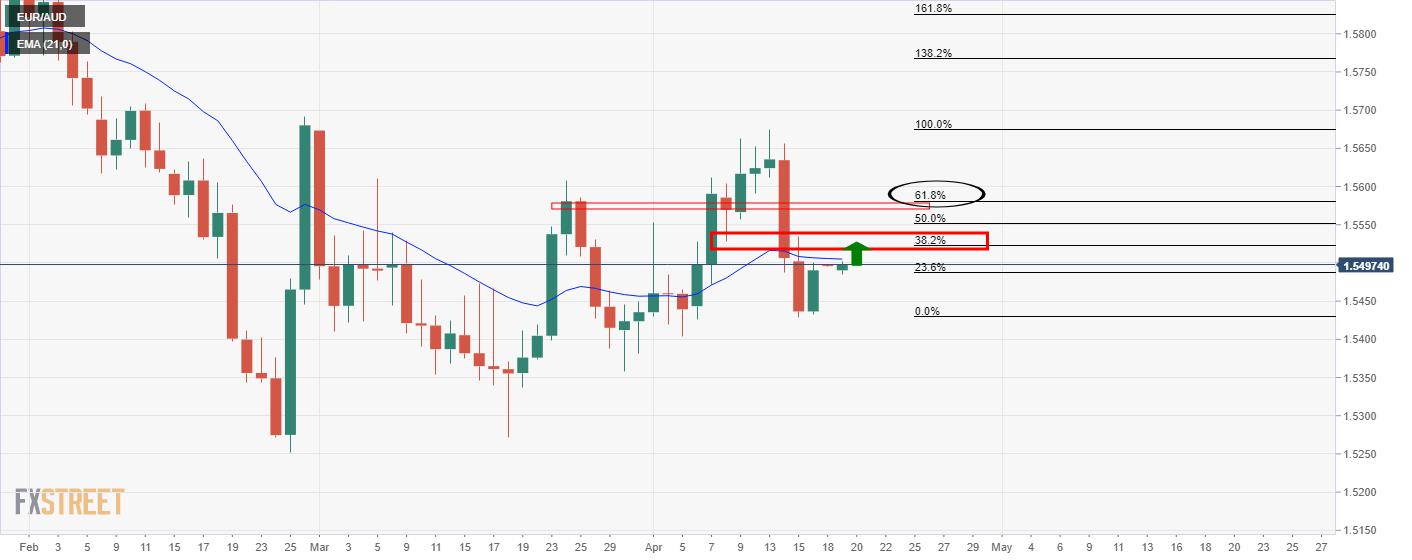
The price is correcting the daily bearish impulse and there is room to go to at least a 38.2% Fibonacci retracement.
A break there opens the risk of a deeper retracement to old support and prior highs which meet a 61.8% Fibo target.
EUR/NZD daily chart
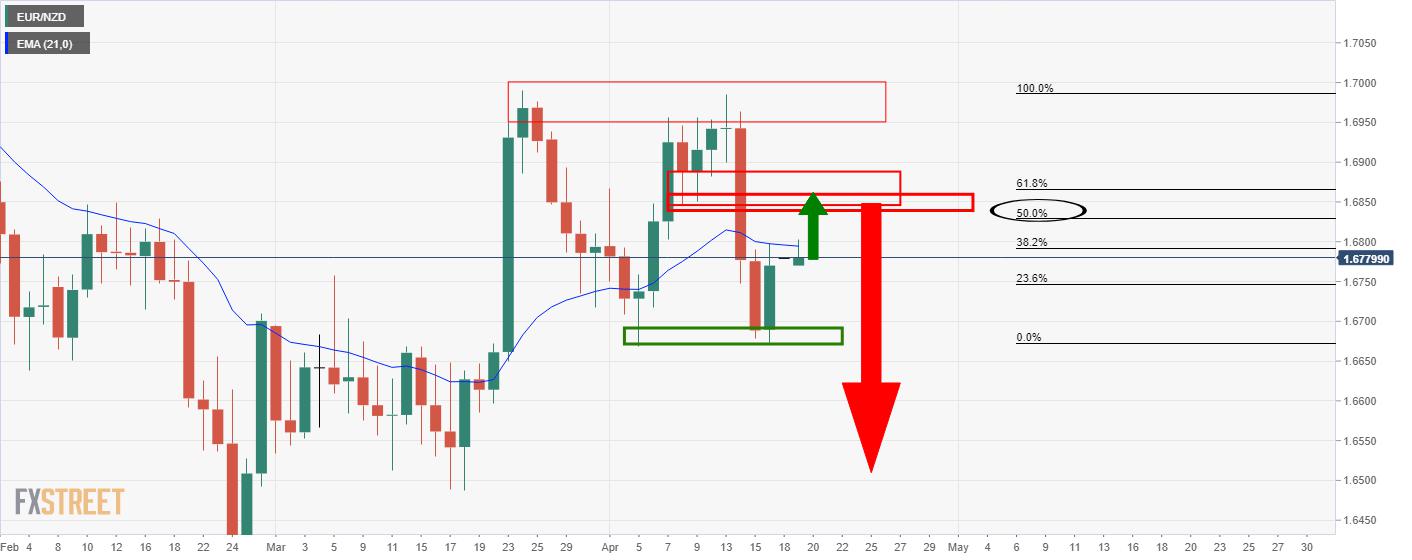
The bulls are in control and while there has been some deceleration in the correction, a break of the 21-EMA opens risk to test the prior lows and a deeper 50% mean reversion confluence.
This would be expected to act as resistance prior to the next leg to the downside to break the double bottom support.
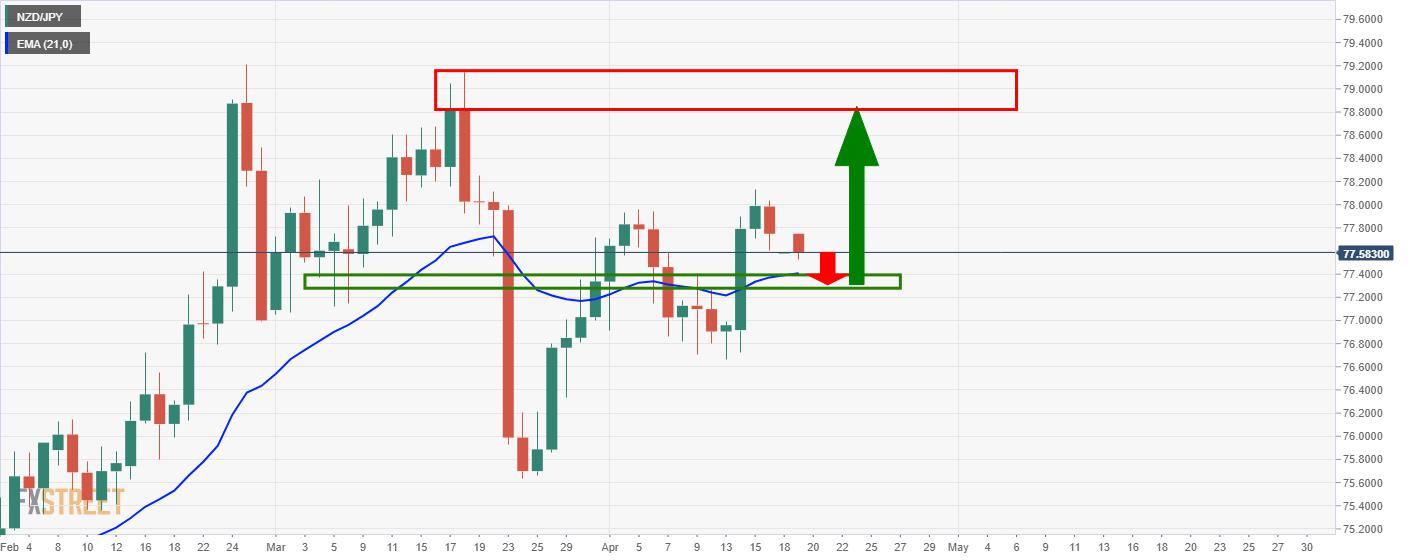
NZD/JPY daily chart
It has been a bearish open for the Kiwi specifically: NZD/USD Price Analysis: Bears take control in the open
This is jolted the NZD/JPY cross lower towards a support target which would be expected to hold and result in a fresh bullish impulse as follows:
AUD/USD daily chart
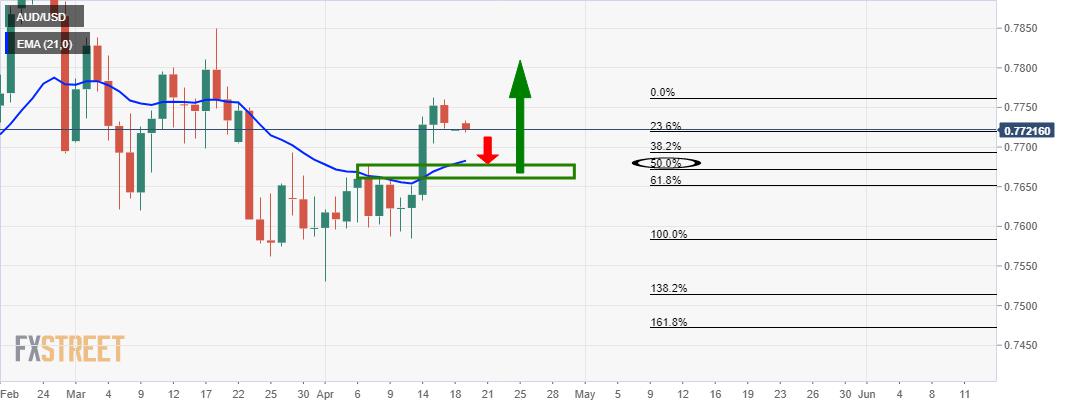
AUD/USD is headed towards a significant 50% mean reversion where there is a confluence of the support structure.
Bears can take advantage of the price action from a lower time frame to determine an optimal entry point.
On the flip side, the pair would be expected to hold at support and turn higher depending on developments in the commodity complex, US yields and the greenback over the forthcoming days and weeks ahead.
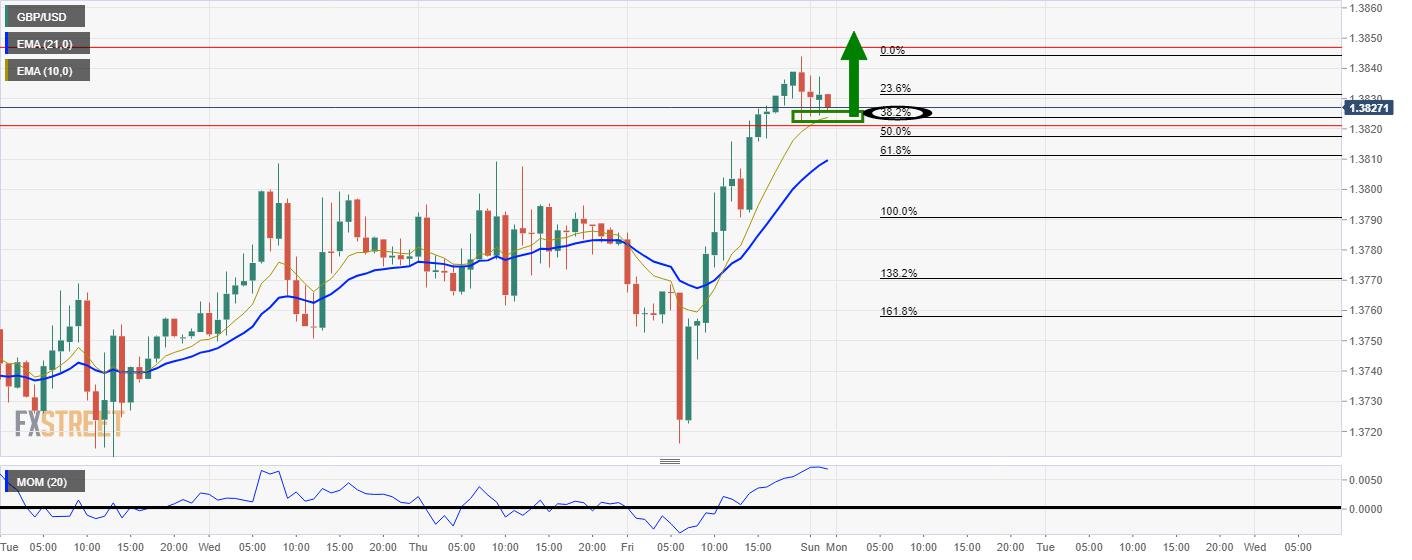
GBP/USD daily chart
As per the prior analysis, GBP/USD Price Analysis: Bears stepping up at critical resistance, as premature as it was, the outlook remains the same while the price fails to break higher and beyond the supply zone:
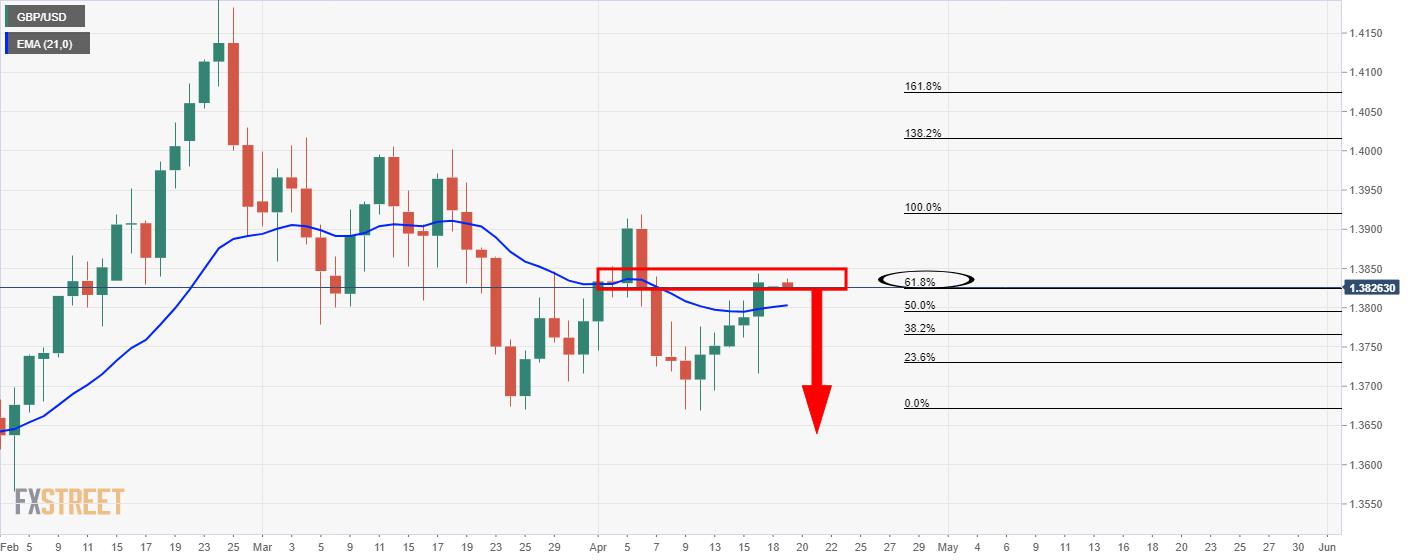
With that being said, while above the 21-EMA, there are prospects of a break to the upside and the hourly chart should be monitored for a bullish opportunity for a significant test of the daily resistance structure:
Reprinted from FXStreet_id,the copyright all reserved by the original author.
Disclaimer: The content above represents only the views of the author or guest. It does not represent any views or positions of FOLLOWME and does not mean that FOLLOWME agrees with its statement or description, nor does it constitute any investment advice. For all actions taken by visitors based on information provided by the FOLLOWME community, the community does not assume any form of liability unless otherwise expressly promised in writing.
FOLLOWME Trading Community Website: https://www.followme.com


Hot
No comment on record. Start new comment.