AUD/USD Price Analysis: Keeps the red below mid-0.7700s, downside seems limited

- AUD/USD witnessed some profit-taking on the last trading day of the week.
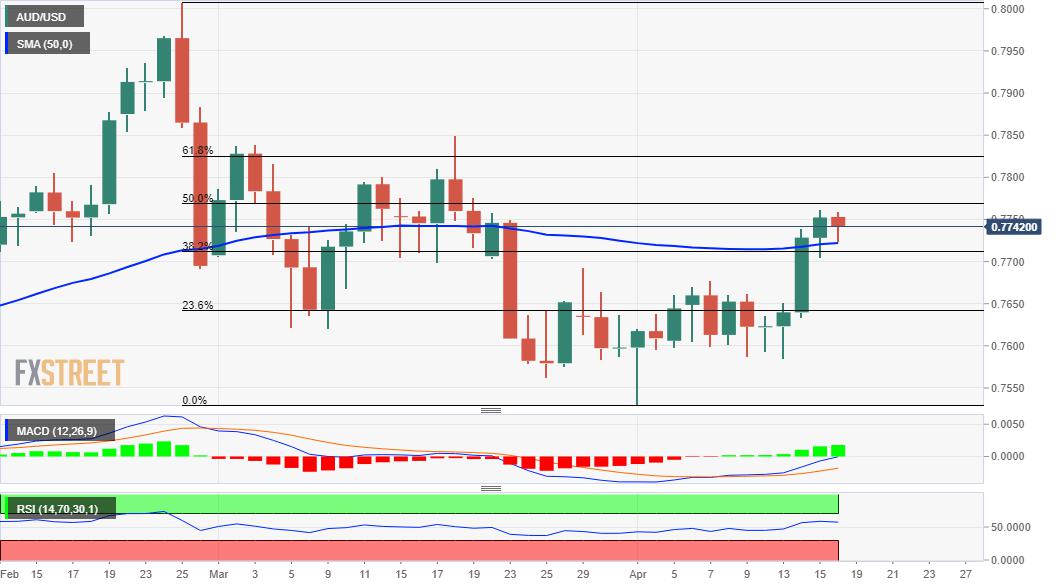
- The downside remains cushioned near the 0.7715-10 confluence support.
- The set-up favours bullish traders and supports prospects for further gains.
The AUD/USD pair edged lower on the last trading day of the week and eroded a part of the previous day's positive move to four-week tops. The pair was last seen trading just below mid-0.7700s, down 0.15% for the day.
Mixed Chinese economic releases seemed to be the only factor that prompted some profit-taking around the China-proxy aussie. That said, a softer tone surrounding the US dollar extended some support to the AUD/USD pair. Apart from this, the prevalent risk-on mood further collaborated to limit the downside for the perceived riskier Australian dollar.
Looking at the technical picture, the AUD/USD pair stalled this week's solid rebound from sub-0.7600 levels just ahead of a resistance marked by the 50% Fibonacci level of the 0.8008-0.7531 downfall. The pullback, however, lacked any strong follow-through and the pair, so far, has managed to hold above the 50-day SMA/38.2% Fibo. confluence region.
The mentioned support is pegged near the 0.7715-10 region, which should now act as a key pivotal point for short-term traders and help determine the next leg of a directional move for the AUD/USD pair. Given that oscillators on the daily chart have just started moving into the positive territory, the bias seems tilted in favour of bullish traders.
However, it will still be prudent to wait for a sustained move beyond the 61.8% Fibo. level, around the 0.7765-70 region before positioning for any further appreciating move. The AUD/USD pair might then aim to surpass the 0.7800 mark and test the 61.8% Fibo., around the 0.7825-30 area, which is closely followed by March swing highs near mid-0.7800s.
On the flip side, weakness below the 0.7715-10 confluence resistance-turned-support should now be seen as a buying opportunity. This should help limit the downside near the recent trading range breakpoint, around the 0.7665-60 region. Only a sustained break below the latter will negate the positive bias and prompt some technical selling.
AUD/USD daily chart
Technical levels to watch
Reprinted from FXStreet_id,the copyright all reserved by the original author.
Disclaimer: The content above represents only the views of the author or guest. It does not represent any views or positions of FOLLOWME and does not mean that FOLLOWME agrees with its statement or description, nor does it constitute any investment advice. For all actions taken by visitors based on information provided by the FOLLOWME community, the community does not assume any form of liability unless otherwise expressly promised in writing.
FOLLOWME Trading Community Website: https://www.followme.com


Hot
No comment on record. Start new comment.