
An oscillator is any object or data that moves back and forth between two points.
In other words, it’s an item that is going to always fall somewhere between point A and point B.
Think of when you hit the oscillating switch on your electric fan.
Think of our technical indicators as either being “on” or “off”.
More specifically, an oscillator will usually signal “buy” or “sell” with the only exception being instances when the oscillator is not clear at either end of the buy/sell range.Does this sound familiar? It should!
The Williams %R, Stochastic, Parabolic SAR, and Relative Strength Index (RSI) are all oscillators.
Oscillators work under the premise that as momentum begins to slow, fewer buyers (if in an uptrend) or fewer sellers (if in a downtrend) are willing to trade at the current price.
A change in momentum is often a signal that the current trend is weakening.
Each of these indicators is designed to signal a possible trend reversal, where the previous trend has run its course and the price is ready to change direction.
Let’s take a look at a couple of examples.We’ve slapped on all three oscillators on GBP/USD’s daily chart shown below. Remember when we discussed how to work the Stochastic, Parabolic SAR, and RSI?
If you don’t, we’re sending you back to fifth grade!
Anyway, as you can see on the chart, all three indicators gave buy signals towards the end of December.
Taking that trade would’ve yielded around 400 pips in gains. Ka-ching!
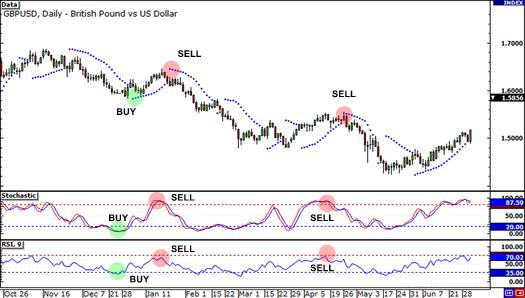
Then, during the third week of January, the Stochastic, Parabolic SAR, and RSI all gave sell signals.
And judging from that long 3-month drop afterward, you would’ve made a whole lot of pips if you took that short trade.
Around mid-April, all three oscillators gave another sell signal, after which the price made another sharp dive.
Now let’s take a look at the same oscillators messing up, just so you know these signals aren’t perfect.In the chart below, you can see that the indicators could give conflicting signals.
For instance, the Parabolic SAR gave a sell signal in mid-February while the Stochastic showed the exact opposite signal.
Which one should you follow?
Well, the RSI seems to be just as undecided as you are since it didn’t give any buy or sell signals at that time.
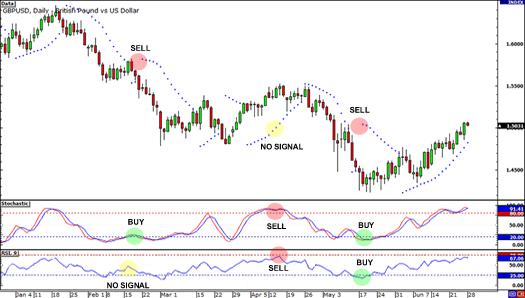
Looking at the chart above, you can quickly see that there were a lot of false signals popping up.
During the second week of April, both the Stochastic and the RSI gave sell signals while the Parabolic SAR didn’t give one.The price kept climbing from there and you could’ve lost a bunch of pips if you entered a short trade right away.
You would’ve had another loss around the middle of May if you acted on those buy signals from the Stochastic and RSI and simply ignored the sell signal from the Parabolic SAR.
What happened to such a good set of indicators?
The answer lies in the method of calculation for each one.
Stochastic is based on the high-to-low range of the time period (in this case, it’s hourly), yet it doesn’t account for changes from one hour to the next.
The Relative Strength Index (RSI) uses the change from one closing price to the next.
Parabolic SAR has its own unique calculations that can further cause conflict.
That’s the nature of oscillators. They assume that a particular price movement always results in the same reversal.
Of course, that’s hogwash.
While being aware of why a leading indicator may be wrong, there’s no way to avoid them.
If you’re getting mixed signals, you’re better off doing nothing than taking a “best guess”. If a chart doesn’t meet all your criteria, don’t force the trade!
Move on to the next one that does meet your criteria.


Hot
No comment on record. Start new comment.