
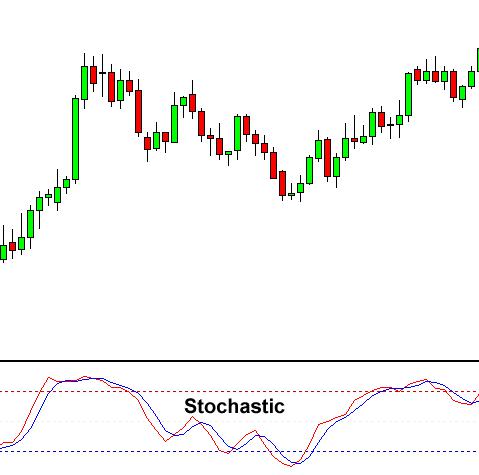
The Stochastic oscillator is another technical indicator that helps traders determine where a trend might be ending.
The oscillator works on the following theory:
- During an uptrend, prices will remain equal to or above the previous closing price.
- During a downtrend, prices will likely remain equal to or below the previous closing price.
This simple momentum oscillator was created by George Lane in the late 1950s.
The Stochastic oscillator uses a scale to measure the degree of change between prices from one closing period to predict the continuation of the current direction trend.Stochastics measures the momentum of price. If you visualize a rocket going up in the air – before it can turn down, it must slow down. Momentum always changes direction before price.
The 2 lines are similar to the MACD lines in the sense that one line is faster than the other.
How to Trade Forex Using the Stochastic Indicator
The Stochastic technical indicator tells us when the market is overbought or oversold. The Stochastic is scaled from 0 to 100.
When the Stochastic lines are above 80 (the red dotted line in the chart above), then it means the market is overbought.When the Stochastic lines are below 20 (the blue dotted line), then it means that the market is possibly oversold.
As a rule of thumb, we buy when the market is oversold, and we sell when the market is possibly overbought.
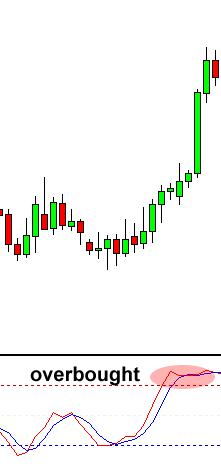
Looking at the currency chart above, you can see that the indicator has been showing overbought conditions for quite some time.
Based on this information, can you guess where the price might go?
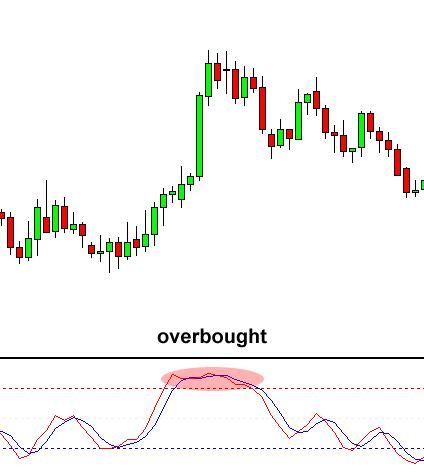
If you said the price would drop, then you are absolutely correct! Because the market was overbought for such a long period of time, a reversal was bound to happen.
That is the basics of the Stochastic.Many forex traders use the Stochastic in different ways, but the main purpose of the indicator is to show us where the market conditions could be possibly overbought or oversold.
Keep in mind that Stochastic can remain above 80 or below 20 for long periods of time, so just because the indicator says “overbought” doesn’t mean you should blindly sell!
The same thing if you see “oversold”, it doesn’t mean you should automatically start buying!
Don’t be a Stochastic Sheep!
Over time, you will learn to use the Stochastic to fit your own personal trading style.
Okay, let’s move on to RSI.


Hot
No comment on record. Start new comment.