
Ichimoku Kinko Hyo?
Yes, you’re still in the right place. You’re still in the School of Pipsology and not in some Japanese pop or anime site.
No, “Ichimoku Kinko Hyo” ain’t Japanese for “May the pips be with you.” but it can help you grab those pips nonetheless.
Ichimoku Kinko Hyo (IKH) is an indicator that gauges future price momentum and determines future areas of support and resistance.
Now that’s 3-in-1 for y’all! Also, know that this indicator is mainly used on JPY pairs.
To add to your Japanese vocab, the word ichimoku translates to “a glance”, kinko means “equilibrium”, while hyo is Japanese for “chart.”
Putting that all together, the phrase ichimoku kinko hyo stands for “a glance at a chart in equilibrium.”
Huh, what does all that mean?
A chart might make things easier to explain…
Whoops. That didn’t help. A few more lines and this will resemble a seismograph.
Before you go off and call this gibberish, let’s break down the components of Ichimoku Kinko Hyo so it’s easy to understand.But before we do that, there are a couple of things about this indicator that you should know about first:
- Ichimoku can be used in all time frames for any tradeable asset. (It was originally used to trade rice!)
- Ichimoku can be used in both rising and falling markets.
So when CAN’T you use Ichimoku?
When no clear trend exists.
Basically, when the market is trading sideways, choppy, aka trendless.
You’ll know it’s trendless when the price is oscillating on either side of the cloud.
Got it! Excellent.
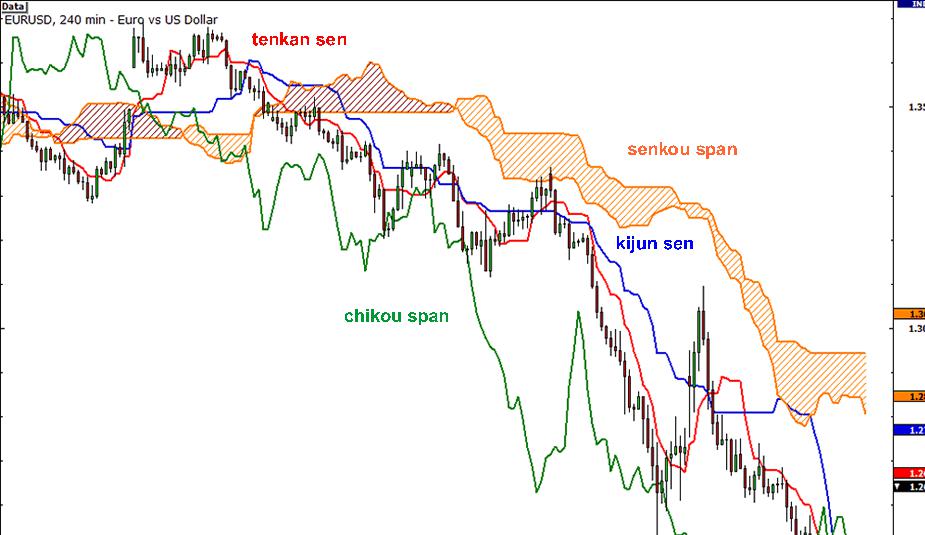
Now let’s try to find out what each of the lines is for.
Kijun Sen (blue line): Also called the standard line or base line, this is calculated by averaging the highest high and the lowest low for the past 26 periods.
Tenkan Sen (red line): This is also known as the turning line and is derived by averaging the highest high and the lowest low for the past nine periods.
Chikou Span (green line): This is called the lagging line. It is today’s closing price plotted 26 periods behind.
Senkou Span (orange lines): The first Senkou line is calculated by averaging the Tenkan Sen and the Kijun Sen and plotted 26 periods ahead.
The second Senkou line is determined by averaging the highest high and the lowest low for the past 52 periods and plotted 26 periods ahead.
 Got it? Well, it’s not really necessary for you to memorize how each of the lines is computed.
What’s more important is for you to know how to interpret these fancy lines.
How to Trade Using Ichimoku Kinko Hyo
Senkou
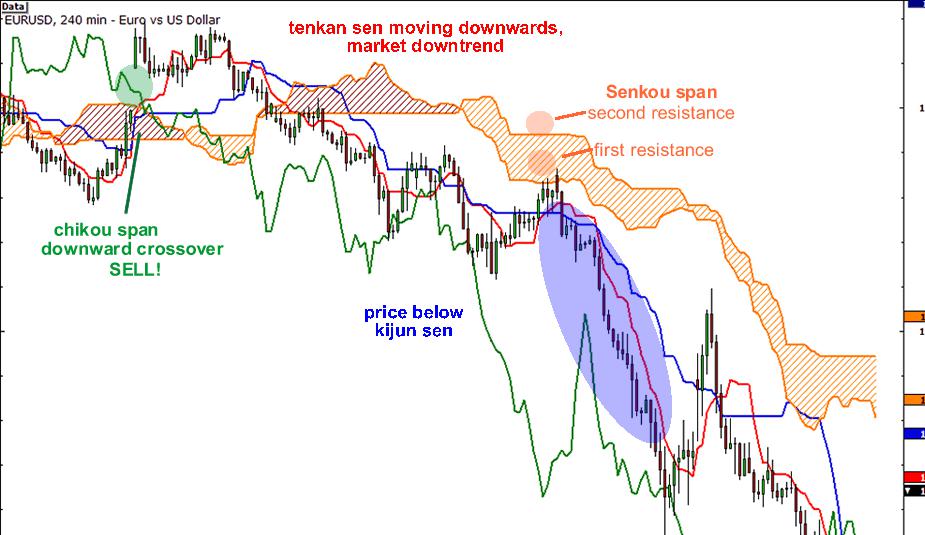
Let’s take a look at the Senkou span first.
If the price is above the Senkou span, the top line serves as the first support level while the bottom line serves as the second support level.
If the price is below the Senkou span, the bottom line forms the first resistance level while the top line is the second resistance level. Got it?
Kijun Sen
Meanwhile, the Kijun Sen acts as an indicator of future price movement.
If the price is higher than the blue line, it could continue to climb higher.
If the price is below the blue line, it could keep dropping.
Tenkan Sen
The Tenkan Sen is an indicator of the market trend.
If the red line is moving up or down, it indicates that the market is trending.
If it moves horizontally, it signals that the market is ranging.
Chikou Span
Lastly, if the Chikou Span or the green line crosses the price in the bottom-up direction, that’s a buy signal.
If the green line crosses the price from the top-down, that’s a sell signal.
Here’s that line-filled chart once more, this time with the trade signals:
It sure looks complicated at first but this baby’s got support and resistance levels, crossovers, oscillators, and trend indicators all in one go! Amazing, right?
As a trend following indicator, Ichimoku can be used in any market, in any timeframe.Regardless of the market, Ichimoku emphasizes to trade in the direction of the trend and NOT against the trend.
By following trends, Ichimoku can help you to avoid entering the wrong side of where the market.
Okey dokey, we’ve already covered a smorgasbord of indicators. Let’s see how we can put all of what you just learned together…


Hot
No comment on record. Start new comment.