
How is Heikin Ashi different from a typical candlestick?
Let’s learn the difference between a Heikin Ashi candlestick versus a traditional Japanese candlestick chart.
A picture is worth a thousand pips so let’s look at some actual charts.
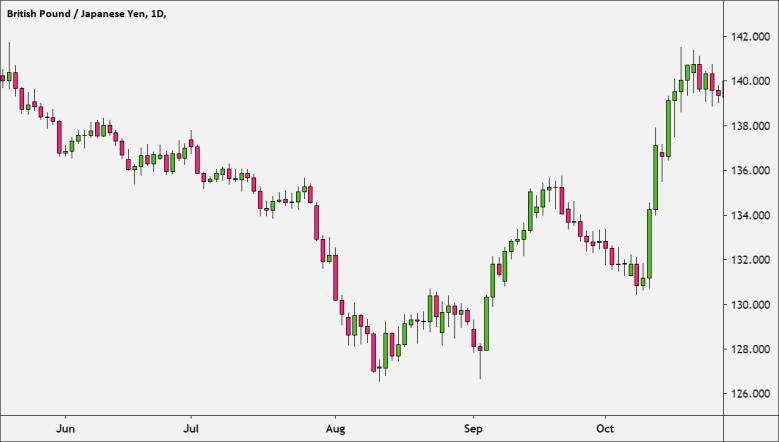
First, here’s a traditional Japanese chart of GBP/JPY on the daily (1D) timeframe:
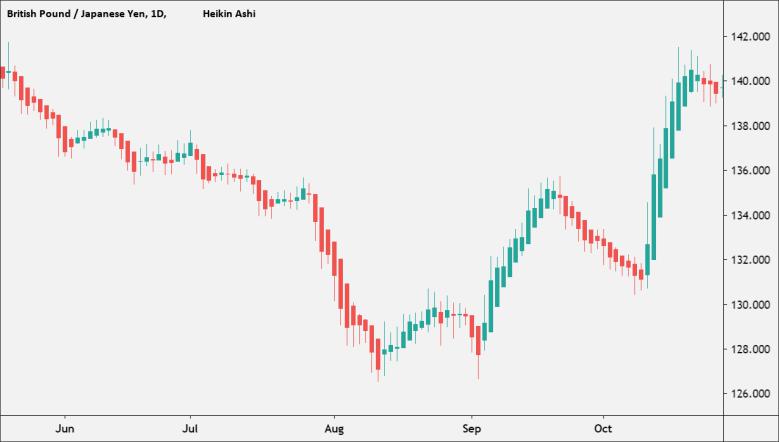
Here’s the same GBP/JPY displayed with a Heikin Ashi candlestick chart:
Let’s put them both side-by-side:
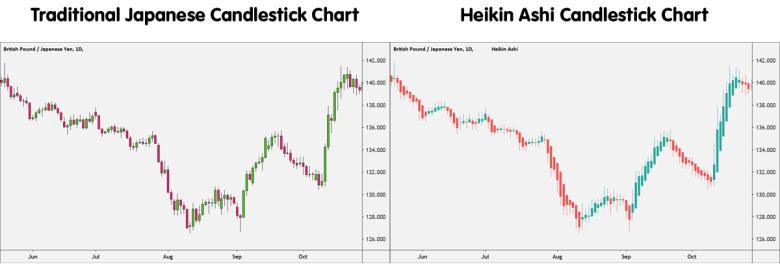
The chart on the LEFT is the traditional Japanese candlestick chart, and the chart on the RIGHT is the Heikin Ashi chart.
As you can see from the chart on the right, directional moves are smoothed out in a way absent from the left chart.
Candles on traditional Japanese candlestick charts frequently change from green to red (up or down) which can make them difficult to interpret.On the other hand, candles on the Heikin Ashi chart display more consecutive colored candles, helping traders to identify past price movements more easily.
You’ll notice that Heikin Ashi charts have a tendency for its candles to stay green during an uptrend and stay red during a downtrend.
This is in contrast to traditional Japanese candlesticks that alternate color even if the price is moving strongly in one direction.
There are times when the candlesticks change color almost as often as Kylie Jenner changes her hair color.
You probably didn’t even notice the image above is a candlestick chart. 😂
Anyways, back to the side-by-side chart…
You can clearly see that the Heikin Ashi chart is much smoother looking in terms of price action.
This is why some forex traders prefer to use the Heikin Ashi candles since it reduces the noise on the chart, and allows them to analyze trends more clearly.
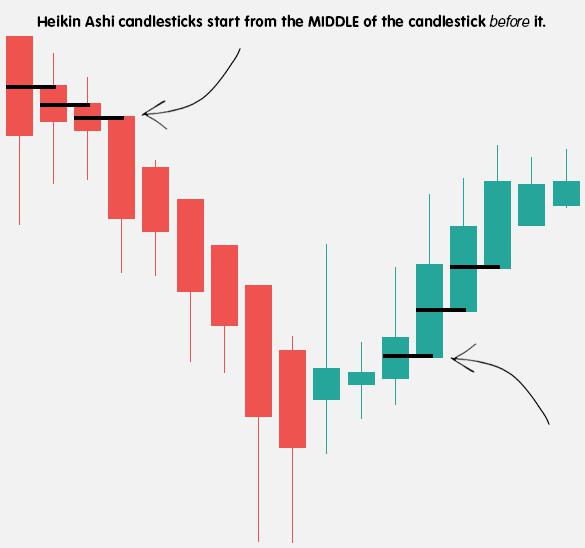
What makes Heikin Ashi different from a traditional Japanese candlestick chart is how the price is displayed in terms of the open and the close.If you look closely at the Heikin Ashi chart, you’ll notice that each of the Heikin Ashi candlesticks start from the MIDDLE of the candlestick before it, and not from the level where the previous candlestick had closed.
Heikin Ashi candlesticks “act” this way due to the way they are calculated.
In the next lesson, you’ll learn how to calculate Heikin Ashi so you can sound super smart at dinner parties.


Hot
-THE END-