
What is a trending market?
A trending market is one in which price is generally moving in one direction.
Sure, the price may go against the trend every now and then, but looking at the longer time frames would show that those were just retracements.
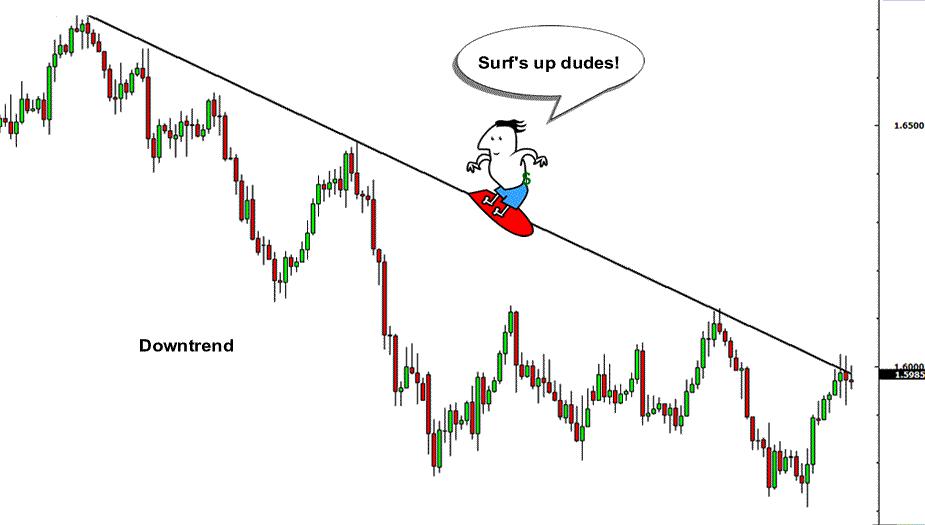
Trends are usually noted by “higher highs” and “higher lows” in an uptrend and “lower highs” and “lower lows” in a downtrend.
When trading a trend-based strategy, traders usually pick the major currencies as well as any other currency utilizing the dollar because these pairs tend to trend and be more liquid than other pairs.Liquidity is important in trend-based strategies. The more liquid a currency pair, the more movement (a. k. a. volatility) we can expect.
The more movement a currency exhibits, the more opportunities there are for price to move strongly in one direction as opposed to bouncing around within small ranges.
Other than eyeballing price action, you can also make use of technical tools you have learned in previous sections to determine whether a currency pair is trending or not.ADX in a Trending Market
A way to determine if the market is trending is through the use of the Average Directional Index indicator or ADX for short.
Developed by J. Welles Wilder, this indicator uses values ranging from 0-100 to determine if the price is moving strongly in one direction, i.e. trending, or simply ranging.
Values more than 25 usually indicate that price is trending or is already in a strong trend.
The higher the number is, the stronger the trend.
However, the ADX is a lagging indicator which means that it doesn’t necessarily predict the future.
It also is a non-directional indicator, which means it will report a positive figure whether the price is trending up or down.
Take a look at this example…
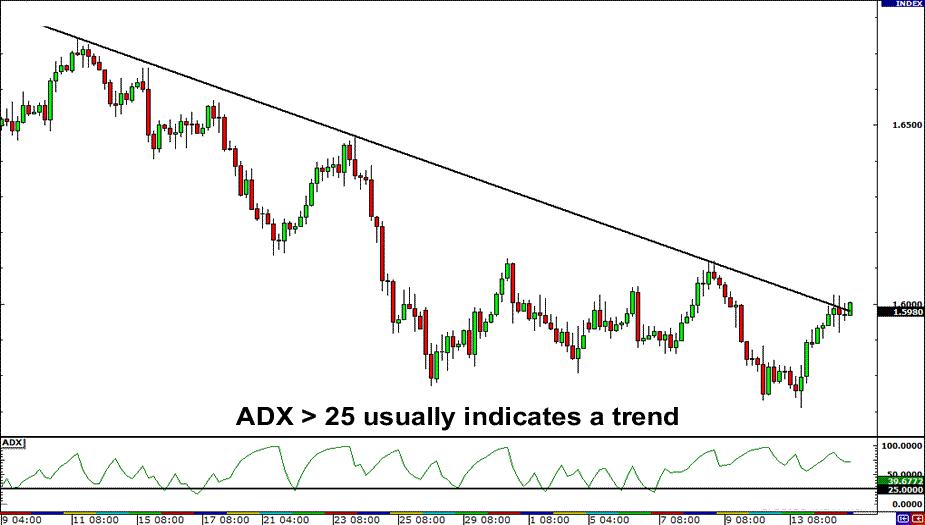
Price is clearly trending downwards even though ADX is greater than 25.
Moving Averages in a Trending Market
If you’re not a fan of the ADX, you can also make use of simple moving averages.
Check this out!
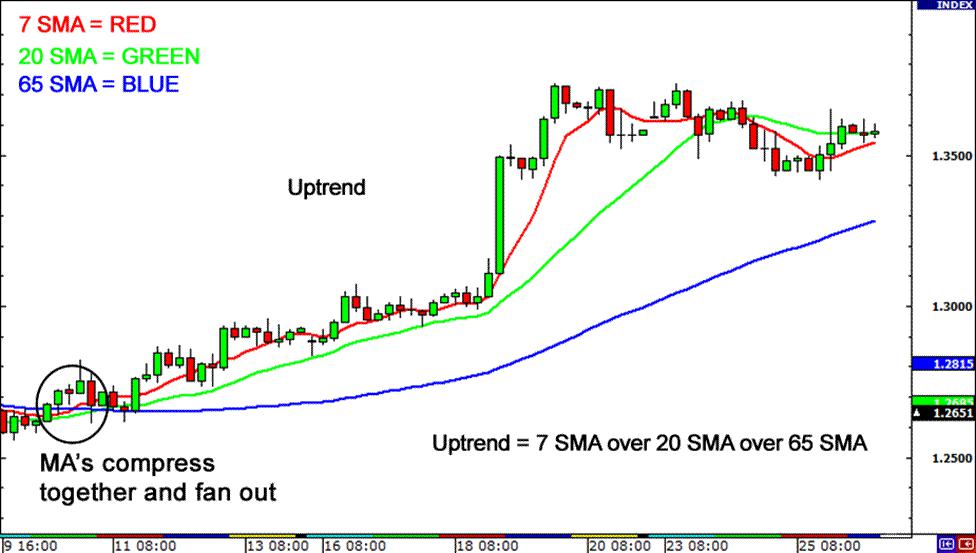
Place a 7 period, a 20 period, and a 65 period Simple Moving Average on your chart.
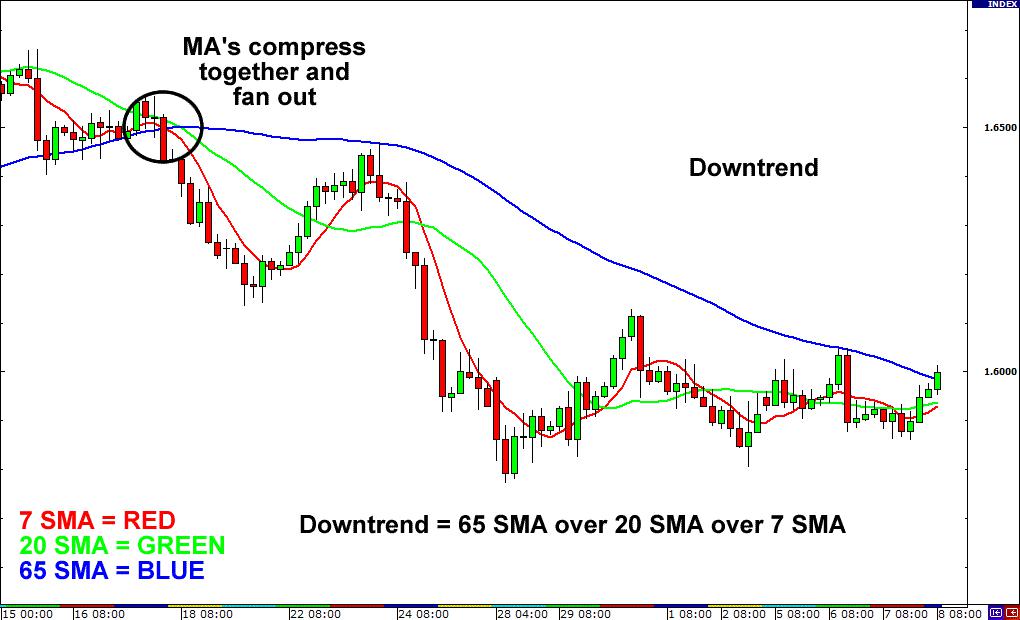
Then, wait until the three SMAs compress together and begin to fan out.
If the 7 period SMA fans out on top of the 20 period SMA and the 20 SMA on top of the 65 SMA, then the price is trending up.
On the other hand, if the 7 period SMA fans out below the 20 period SMA, and the 20 SMA is below the 65 SMA, then price is trending down.
Bollinger Bands in a Trending Market
One tool that is often used for range-bound strategies can also be helpful in trend discovery. We’re talking about Bollinger Bands or just Bands.
One thing you should know about trends is that they are actually quite rare.
Contrary to what you might think, prices really range 70-80 percent of the time.In other words, it is the norm for the price to range.
So, if prices deviate from the “norm” then they must be in a trend, right?
What is one of the best technical tools we have mentioned in the previous grades that measure deviation?
If you said a ruler, we give you mad props for effort.
If you said Bollinger Bands, we’ll give you cyber milk and cookies! Here, take some.

Bollinger Bands actually contain the standard deviation formula. But don’t worry about being a nerd and figuring out what that is.
Here’s how we can use Bollinger Bands to determine the trend! Prepare for the craziness.
Place Bollinger Bands with a standard deviation (SD) of “1” and another set of bands with a standard deviation (SD) of “2”.
You will see three sets of price zones: the sell zone, the buy zone, and the “No Man’s Land“.
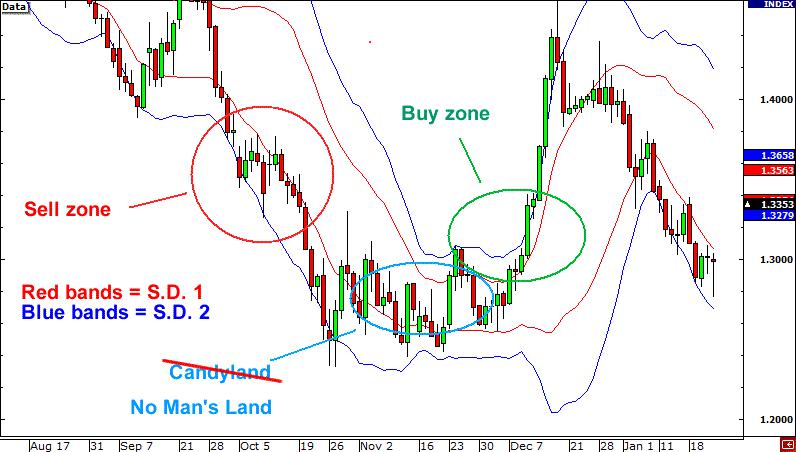
The sell zone is the area between the two bottom bands of the standard deviation 1 (1SD) and standard deviation 2 (2SD) bands. Bear in mind that price has to close within the bands in order to be considered in the sell zone.
The buy zone is the area between the two top bands of the 1SD and 2SD bands. Like the sell zone, price has to close within the two bands in order to be considered in the buy zone.
The area in between the standard deviation 1 bands is an area in which the market struggles to find direction.Price will close within this area if the price is really in “No-Man’s Land”. Price direction is pretty much up for grabs.
The Bollinger Bands make it easier to confirm a trend visually.
Downtrends can be confirmed when the price is in the sell zone.
Uptrends can be confirmed when the price is in the buy zone.


Hot
No comment on record. Start new comment.