AUD/USD Price Analysis: Remains vulnerable below 100-hour SMA, around 0.7600 mark

- AUD/USD struggled to perverse intraday gains to one-week tops amid sustained USD buying.
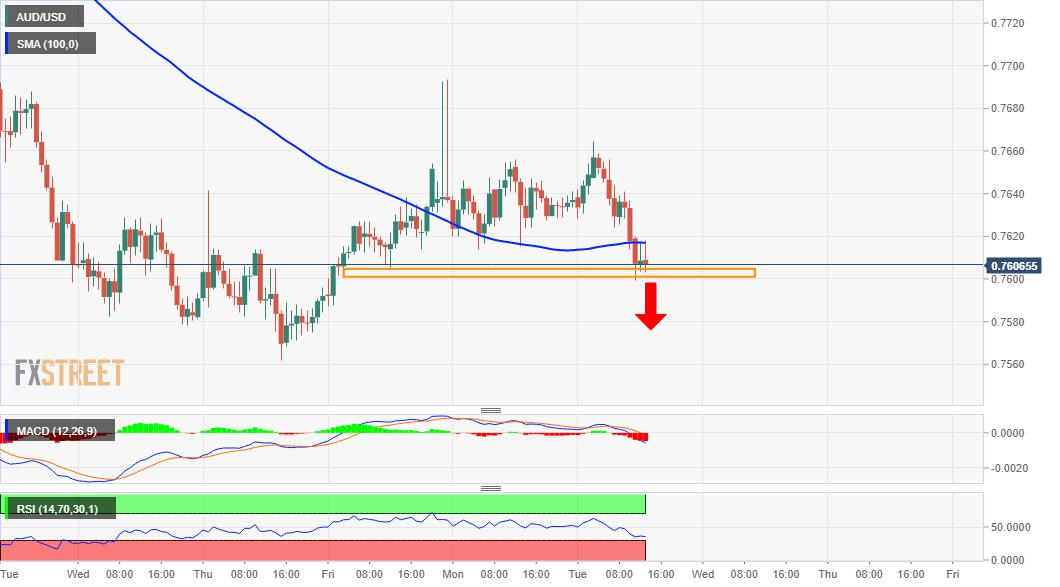
- Weakness back below the 0.7600 mark will now be seen as a fresh trigger for bearish traders.
The AUD/USD pair extended its intraday retracement slide from one-week tops and refreshed daily lows, around the 0.7600 mark heading into the American session.
A sustained break below 100-hour SMA was seen as a key trigger for bearish traders amid a strong follow-through US dollar buying interest. Against the backdrop of the upbeat US economic outlook, a sharp intraday spike in the US Treasury bond yields provided an additional boost to the greenback.
Meanwhile, technical indicators on the daily chart have started drifting into the negative zone and support prospects for an extension of the recent depreciating move. That said, the AUD/USD pair, so far, has been showing some resilience below the 100-day SMA, warranting caution for bearish traders.
Hence, it will be prudent to wait for some follow-through selling below the 0.7600 mark before placing fresh bearish bets. The AUD/USD pair might then turn vulnerable to weaken further below monthly swing lows, around the 0.7565-60 region and accelerate the slide to test the key 0.7500 psychological mark.
On the flip side, the overnight closing level, around the 0.7630 region now seems to act as immediate strong resistance. Any subsequent move might be seen as an opportunity to initiate fresh bearish positions and once again fizzle out near the daily swing highs, around the 0.7660-65 region.
That said, some follow-through buying will negate the negative outlook and prompt some short-covering move. The AUD/USD pair might then aim back to reclaim the 0.7700 round-figure mark.
AUD/USD 1-hourly chart
Technical levels to watch
Reprinted from FXStreet_id,the copyright all reserved by the original author.
Disclaimer: The content above represents only the views of the author or guest. It does not represent any views or positions of FOLLOWME and does not mean that FOLLOWME agrees with its statement or description, nor does it constitute any investment advice. For all actions taken by visitors based on information provided by the FOLLOWME community, the community does not assume any form of liability unless otherwise expressly promised in writing.
FOLLOWME Trading Community Website: https://www.followme.com


Hot
No comment on record. Start new comment.