NZD/USD Price Analysis: Kiwi hits one-month low after close under 50-day SMA

- NZD/USD extends Thursday's losses, hits a four-week low.
- Breakdown of key support and bearish RSI favor deeper losses.
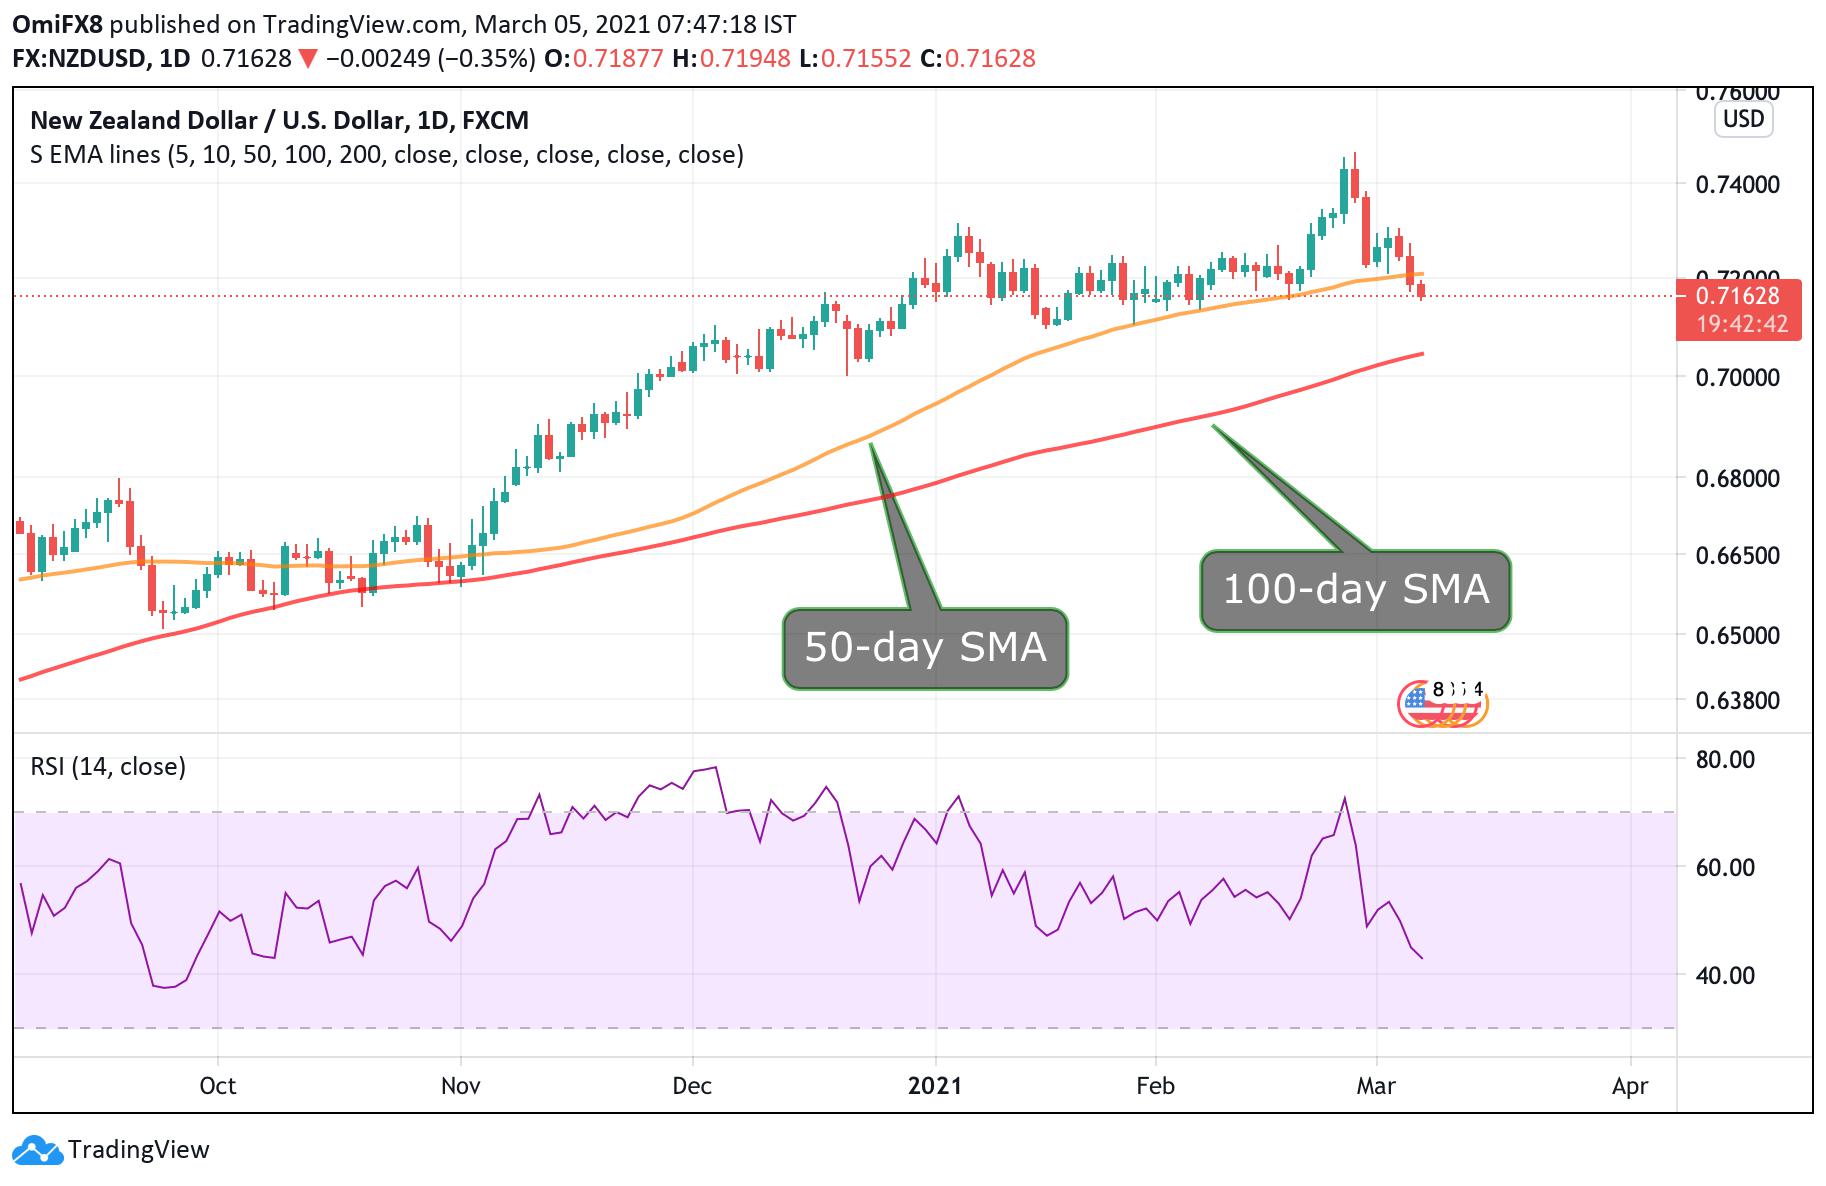
NZD/USD slipped to 0.7155 a few minutes before press time, the lowest since Feb. 5.
The pair closed below the 50-day Simple Moving Average (SMA) on Thursday, validating the bearish lower high of 0.7307 created on March 2.
The violation of the 50-day SMA in itself is bearish, as the technical line acted as strong support multiple times since Jan. 28.
That, alongside a bearish or below-50 reading on the 14-day Relative Strength Index, suggests scope for deeper losses.
Support is seen at 0.7096 (Jan. 18 low) followed by 0.7047 (100-day SMA). Meanwhile, resistance is located at 0.7210 (50-day SMA) and 0.7307 (March 2 high).
Daily chart
Trend: Bearish
Technical levels
Reprinted from FXStreet,the copyright all reserved by the original author.
Disclaimer: The content above represents only the views of the author or guest. It does not represent any views or positions of FOLLOWME and does not mean that FOLLOWME agrees with its statement or description, nor does it constitute any investment advice. For all actions taken by visitors based on information provided by the FOLLOWME community, the community does not assume any form of liability unless otherwise expressly promised in writing.
FOLLOWME Trading Community Website: https://www.followme.com


Hot
No comment on record. Start new comment.