NZD/USD Price Analysis: All eyes on 41-month-old resistance above 0.7400

- NZD/USD defies pullback from August 2017 top following its bounce off 0.7420.
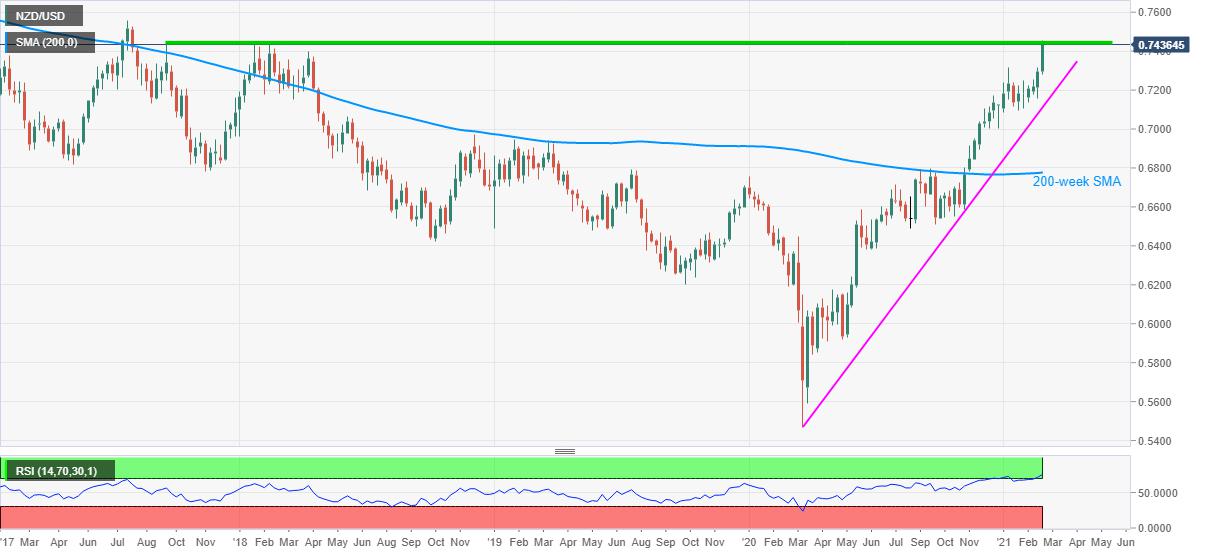
- Weekly closing becomes the key for Kiwi bulls, ascending trend line from March 2020 offers key support.
NZD/USD trims intraday losses while picking up bids to 0.7438, down 0.15% on a day, while heading into the European session on Thursday.
The quote jumped to the highest since August 2017 earlier in Asia but failures to stay beyond a horizontal area comprising multiple tops marked since September 2018 triggered the following pullback to the day’s low of 0.7420. It’s worth mentioning that the overbought RSI conditions also question the kiwi pair’s further upside.
Hence, unless witnessing a weekly closing beyond the 0.7435-46 area, the NZD/USD bulls are likely to remain skeptical. Following that, the 0.7500 and July 2017 peak of 0.7560 should return to the chart.
Meanwhile, pullback moves may target January’s top near 0.7315 and may become less harmful to the uptrend beyond 0.7080 level comprising an 11-month-old support line.
However, a weekly closing below 0.7080 might not refrain from marking a gradual downward trajectory towards the 200-bar SMA level of 0.6775.
NZD/USD weekly chart
Trend: Pullback expected
Reprinted from FXStreet,the copyright all reserved by the original author.
Disclaimer: The content above represents only the views of the author or guest. It does not represent any views or positions of FOLLOWME and does not mean that FOLLOWME agrees with its statement or description, nor does it constitute any investment advice. For all actions taken by visitors based on information provided by the FOLLOWME community, the community does not assume any form of liability unless otherwise expressly promised in writing.
FOLLOWME Trading Community Website: https://www.followme.com


Hot
No comment on record. Start new comment.