USD/JPY Price Analysis: Under pressure after failed breakout

- Down 0.13% on the day, USD/JPY eyes support at 103.52.
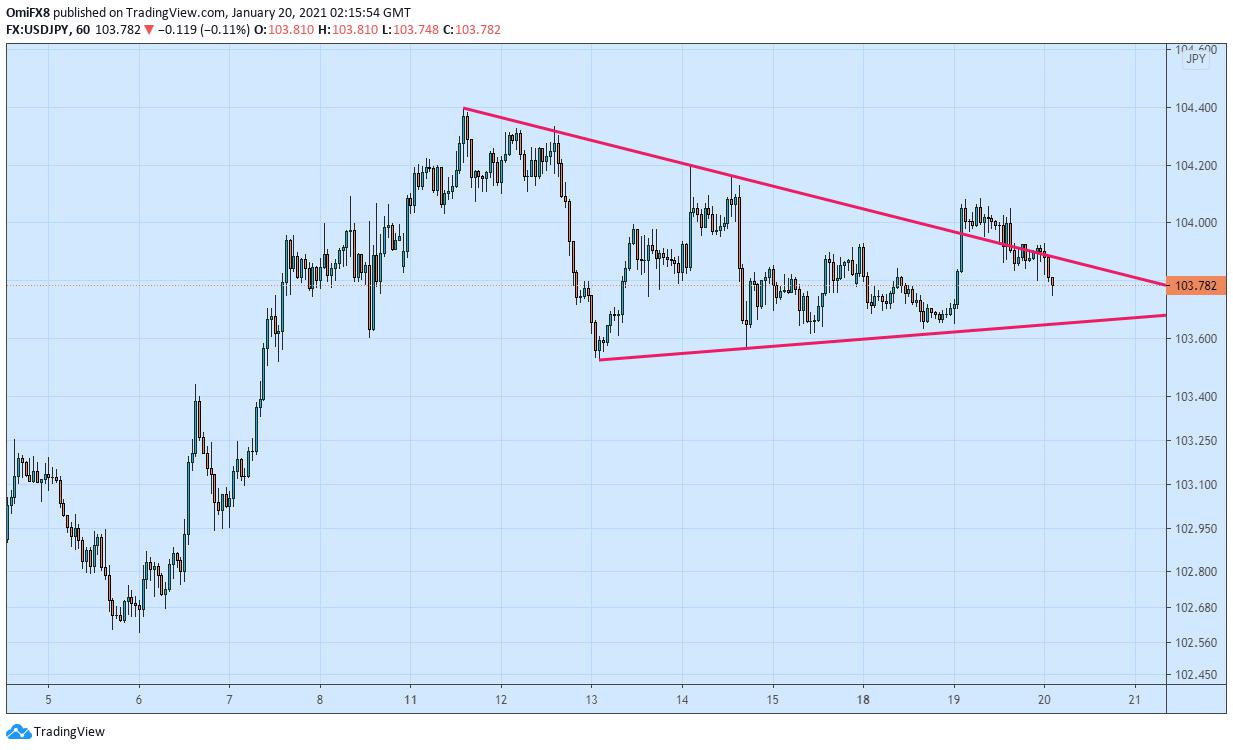
- The hourly chart shows a failed breakout, a bearish pattern.
USD/JPY looks south, with the hourly chart showing a failed breakout.
The pair broke higher from a triangle pattern on Monday, confirming a resumption of the recovery rally from the Jan. 6 low of 102.59. However, that failed to inspire the bulls, and the pair fell back inside the triangle pattern on Tuesday.
The failed breakout, a powerful bearish signal, looks to be attracting selling pressure at press time. The pair is currently trading near 103.77, representing a 0.13% drop on the day and could drop to 103.52 (triangle low). The below-50 reading on the 14-hour Relative Strength Index favors the bearish case.
On the higher side, 104.08 is the level to beat for the bulls. A violation there would revive the bullish outlook and open the doors for 104.40 (Jan. 11 high).
Hourly chart
Trend: Bearish
Technical levels
Reprinted from FXStreet,the copyright all reserved by the original author.
Disclaimer: The content above represents only the views of the author or guest. It does not represent any views or positions of FOLLOWME and does not mean that FOLLOWME agrees with its statement or description, nor does it constitute any investment advice. For all actions taken by visitors based on information provided by the FOLLOWME community, the community does not assume any form of liability unless otherwise expressly promised in writing.
FOLLOWME Trading Community Website: https://www.followme.com


Hot
No comment on record. Start new comment.